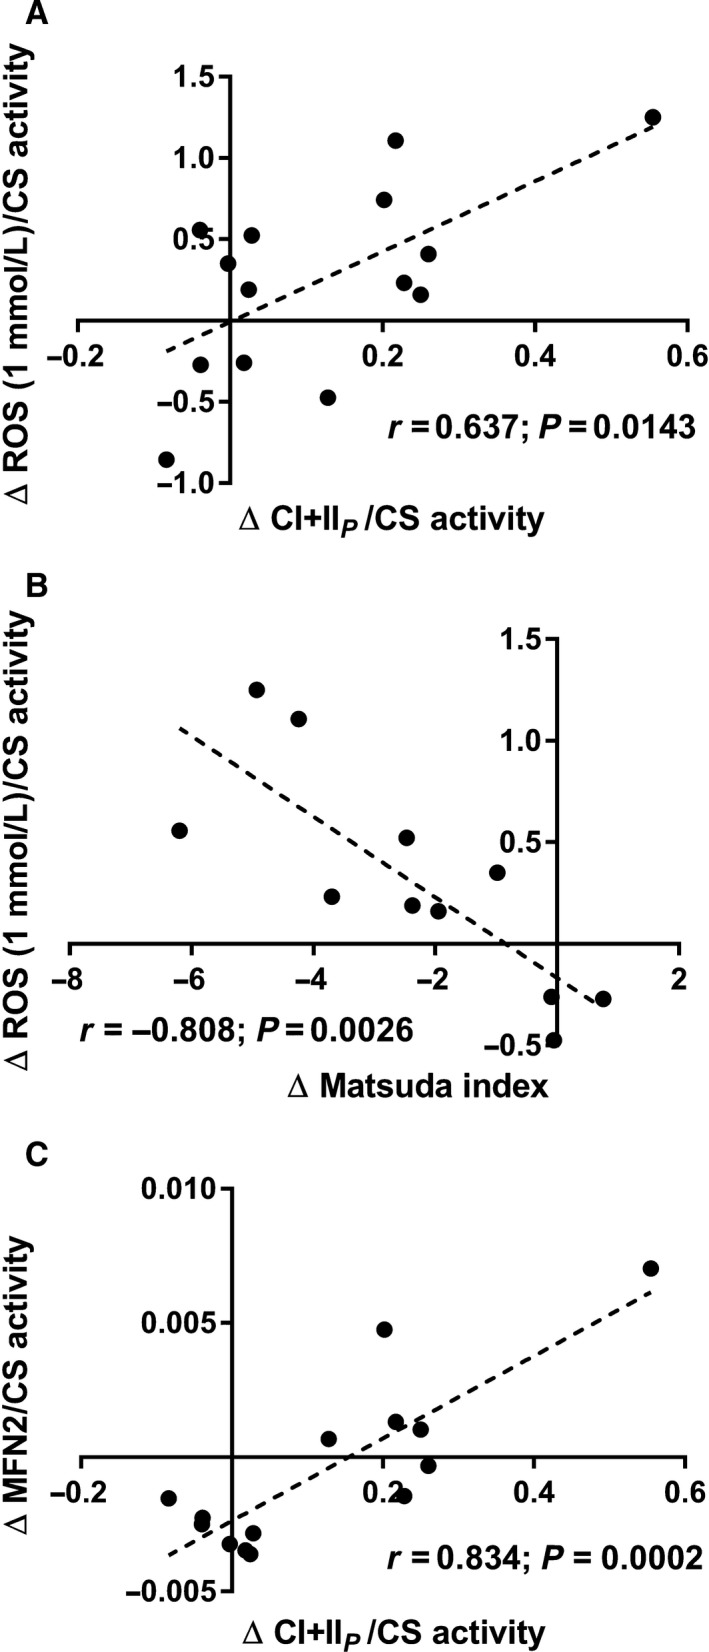
Figure 5.

(A) Correlation between changes in mitochondrial respiratory capacity (CI + IIP) and ROS production (1 mmol/L succinate) both normalized to CS activity. (B) Correlation between changes in the Matsuda index and ROS production (1 mmol/L succinate) normalized to CS activity. (C) Correlation between changes in mitochondrial respiratory capacity (CI + IIP) and MFN2 both normalized to CS activity.
