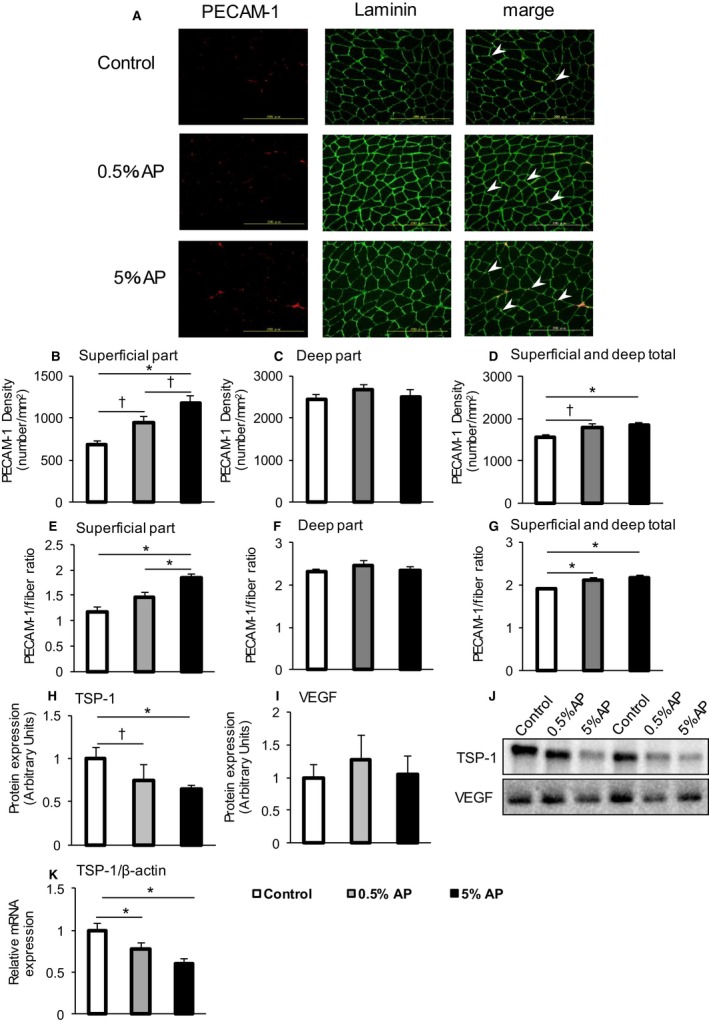
Figure 3.

Measurements of the capillary density of the gastrocnemius muscle. (A) Representative platelet endothelial cell adhesion molecule‐1 (PCAM‐1, left panel), laminin (central panel), and merge (right panel) staining of medial gastrocnemius muscle. Control (upper panel), 0.5% AP (middle panel), and 5% AP (bottom panel) are shown. Arrow heads indicate representative PCAM‐1 signal. (B–D) PCAM‐1 density is shown (superficial part, deep part, superficial and deep total, respectively). (E–G) PCAM‐1/fiber ratio is shown (superficial part, deep part, superficial and deep total, respectively). (H, I) TSP‐1 and VEGF protein levels. (J) Representative western blot. (K) TSP‐1 mRNA expression. The open bar represents the control group, the shaded bar represents the 0.5% AP group, and the closed bar represents the 5% AP group. Data are represented as mean ± SE. Statistical significance was evaluated by one‐way ANOVA with Tukey–Kramer posthoc test. Statistical significance was expressed by *P < 0.05 and † P < 0.1. AP, apple polyphenols
