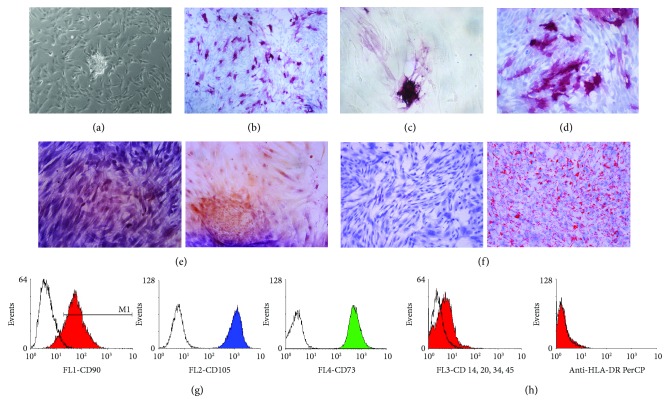
Figure 3.
Characterization of the mesenchymal phenotype of tMSCs. (a–d) A representative picture of a tMSC colony (a) positive for AP staining and the correspondent colony in brightfield (c). Once picked and expanded, the colonies gave rise to a heterogeneous population expressing alkaline phosphatase (b–d). (e–f) Representative pictures of alizarin red staining (e) and oil red staining (f) of tMSCs, indicating osteogenic and adipogenic differentiation. Negative staining is represented on the left side, and positive staining on the right side. Original magnification: (a–c) ×100, (d) ×200, and (e, f) ×100. (g, h) A flow cytometry analysis of one of the tMSC colonies (colony #27). The analysis demonstrates that the cells are positive for CD73, CD105, and CD90 (g). As expected, the cells are negative for CD14, CD34, and HLA-DR (h). This analysis is representative of three independent experiments performed on various colonies.

