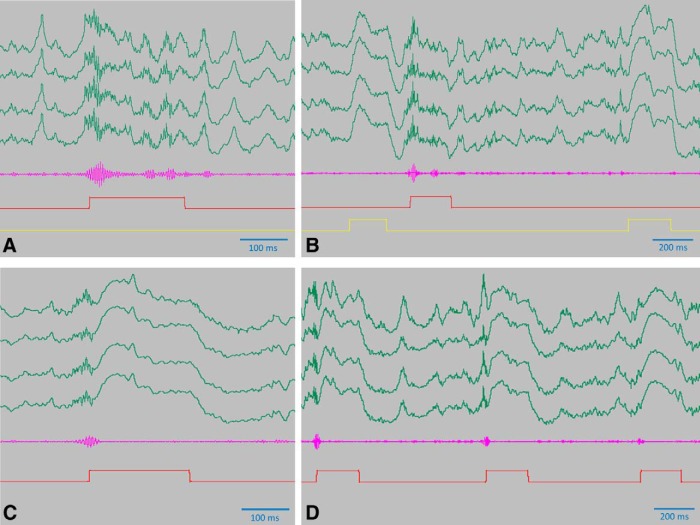
Figure 7.
Efficiency of the SWR-blockade. A, B, Detector signal and delayed light pulses in the control condition. Raw signal from one tetrode (green), bandpass filtered differential signal (for the details of signal processing, see Kovács et al., 2016) fed into the detector (magenta), the 200-ms-long detector signal (red), and delayed signal driving the laser (yellow) is shown. The first delayed signal visible on the left hand side belongs to a previous detector pulse not appearing in the figure. During the 1st 20 min of the 1st 3-h-long middle sleep of a control day, 319 SWR events were detected online (established by counting the detector pulses), out of which nine (2.8%) were undetected by an offline algorithm that found 14 additional SWR events (4.4%). C, D, Detector signal in the SWR blockade condition. Color coding is the same as for panel A and B. The signal coming from the ripple detector is directly driving the laser here, therefore no delayed signal is used. During the 1st 20 min of the 1st 3-h-long middle sleep of a control day, 332 SWR events were detected online (established by counting the detector pulses) out of which 298 (89.7%) were undetected by the offline algorithm, a high percentage to be attributed to the fact that these events themselves were nearly fully destroyed by the light pulses. The offline algorithm detected 11 additional events (3.3%) that were undetected by online algorithm during the intervention. A–D, Note the field responses that are generated by the light pulses and are visible as strong positive deflection of the LFP. Also note the destruction of the oscillation close to the onset of the detector pulse in C, D, and the persisting oscillation in A, B.

