Figure 8.
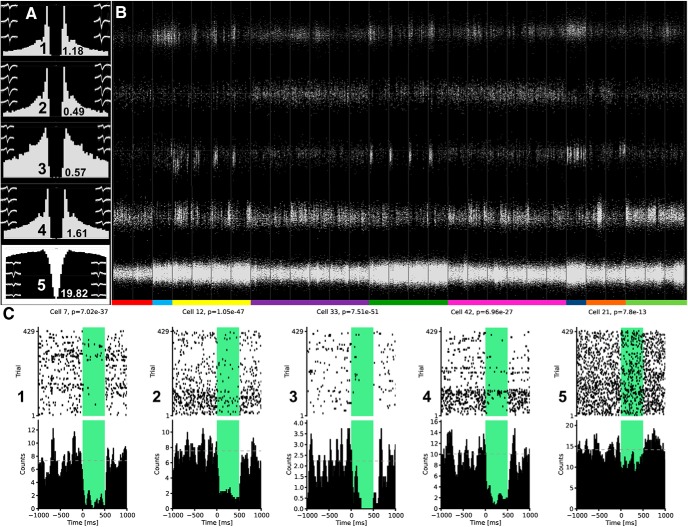
Stability and optogenetic inhibition at single neuron level. A, Interspike interval distributions (temporal autocorrelograms) and firing rates of five selected cells: putative pyramidal cells from the septal pole of the right CA1 (1), the septal pole of the left CA1 (2), the temporal pole of the right CA1 (3), the temporal pole of the left CA1 (4), and a putative interneuron from the CA1 (5). The first and the last hundred waveforms measured during the whole period in B are overlaid and shown as left and right insets, respectively, for each of the five neurons. B, Isolated spikes from the same five cells as in panel A during the entire recording day. The structure of the behavioral paradigm has a clear effect on the firing of the cells. To illustrate this effect, the bar at the bottom of the panel identifies the elements of the paradigm: presleep (red), preprobe (light blue), 1st block of learning trials (yellow), 1st sleep with intervention (purple), 2nd block of learning trials (light green), 2nd sleep with intervention (magenta), postprobe (dark blue), postsleep (orange), final sleep for the assessment of the inhibition (light green). C, Optogenetic inhibition of the five presented cells (same ones as in panels A, B) during the final 30-min-long sleep shown in panel B. During this sleep, regular, 500-ms-long laser pulses were delivered every 4th second. In the upper half of the panel, spike rasters cover the 28.6-min-long middle period of the sleep, in the lower half of the panel, these rasters are summed up to create a histogram; p values derived from the Wilcoxon signed rank sum test is indicated above each raster.

