Figure 3.
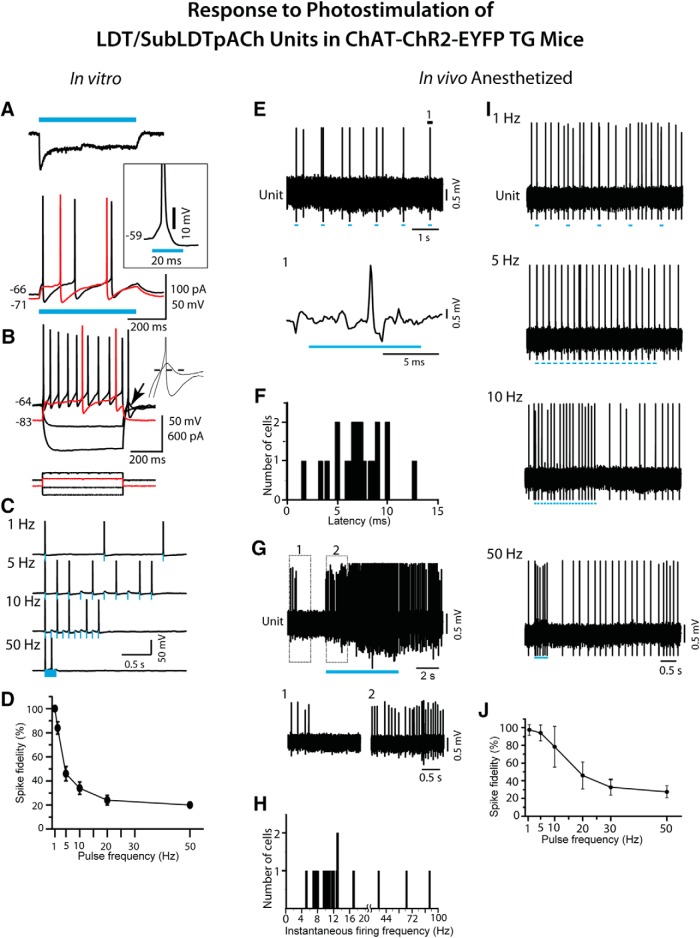
Response of LDT/SubLDT cholinergic units to blue light stimulation in ChAT-ChR2-EYFP TG mice. pACh units were studied in vitro (A–D) in brain slices and in vivo (E–J) in urethane-anesthetized mice. A, In vitro, response of an LDT neuron to blue light stimulation (500-ms pulse, blue bars). Top trace illustrates the characteristic photo-current measured in voltage clamp mode. Inset illustrates the spike emitted during the light pulse at subthreshold potential (-59 mV) in current clamp mode. Bottom traces illustrate the depolarization and spiking produced by this photocurrent from two subthreshold membrane potentials (black trace, -66 mV; red trace, -71 mV). At -71 mV, the spike latency was greatly increased. B, Membrane potential responses (top) of the same neuron to injected current pulses (bottom) from two membrane potentials (black traces -64 mV; red traces -83 mV). The intrinsic properties of this pACh neuron showed evidence of both A-current (delayed excitation from negative membrane potentials; red trace) and T-current (rebound excitation at termination of hyperpolarizing current pulses; arrow). Inset, Traces expanded around rebound. From -91 mV, the membrane potential rebound was subthreshold, but from -119 mV, it evoked a spike. Dashed line marks -64 mV. C, Spiking produced by trains of 10 light pulses (10-ms duration) delivered at 1, 5, 10, and 50 Hz from ∼-60 mV for the same cell illustrated in A, B. Blue bars indicate the timing and duration of the light pulses. D, Summary of spike fidelity of pACh LDT neurons versus light pulse frequency (mean ± SEM; n = 5). E, In vivo, spiking in response to 10 light pulses (applied every second) by a pACh unit in a TG-A mouse. Segment of trace labeled 1 is expanded below (unit #12 in mouse ChAT6). F, The spike latencies of units identified as pACh (n = 21). G, During a long (∼5 s) continuous light pulse, pACh units fired repetitively at near maximal tonic discharge rates. Segments 1 and 2 are expanded below. H, The instantaneous firing frequencies of pACh units (n = 18) during long (∼5 s) continuous light pulses. Note that the x-axis and its scale are split at 20 Hz to include higher frequencies. I, Spiking of pACh unit (#12 in mouse ChAT6) in response to short (∼15 ms) light pulses at different frequencies. J, Spike fidelity of pACh units to short pulse stimulation at different frequencies (mean ± SEM; n = 6).

