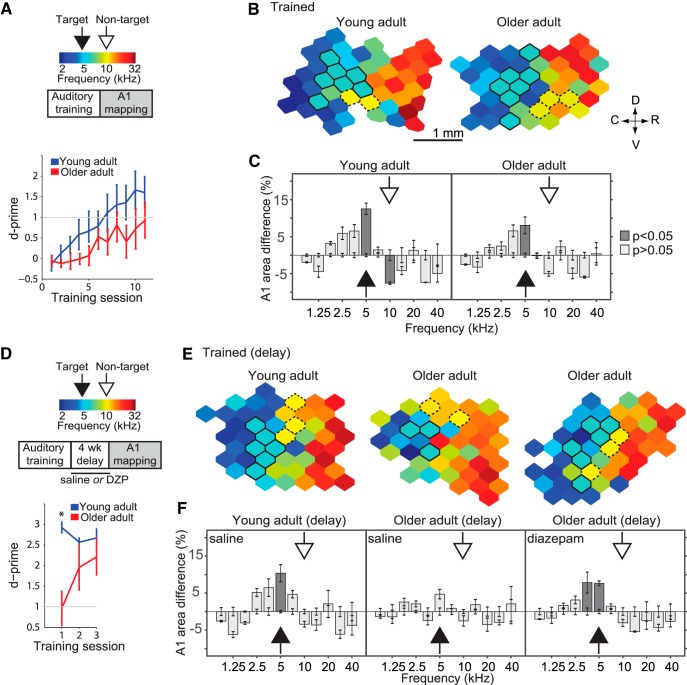
Figure 4.
Aging and decay of training-induced A1 plasticity. Young and old adult rats were trained on a two-tone discrimination task (target tone: 10 kHz, nontarget: 5 kHz). A, Top: Experimental protocol. Bottom: Older adult rats needed on average more training sessions to reach criterion than young adult rats (D-prime ≥1; YA no. of sessions = 8.4 ± 1.1; OA = 11.9 ± 1.4, p = 0.03). B, Representative A1 characteristic frequency (CF) maps from trained young (left) and old (right) adult rats. Bolded polygons have a CF at the target tone ±0.3 octaves. Hatched polygons have a CF at the nontarget tone ±0.3 octaves. C, Difference in frequency tuning between naïve and exposed rats expressed as A1 percentage area and separated by CF. The full arrows point to the target frequency; the hatched arrows points to the nontarget frequency. D, Top: To determine the persistence of learning and training-induced A1 map plasticity, a subgroup of YA-T and two subgroups of OA-T rats were subjected to a 4-week delay after reaching criterion, followed by behavioral re-assessment and A1 mapping. Bottom: From the first session of the reassessment onwards, young adult rats performed above criterion, while old adult rats performed above criterion from the second session onwards. E, Representative A1 characteristic frequency (CF) maps from trained rats that received daily sham (saline) or diazepam (DZP) injections during the delay period. F, Difference in A1 area tuned to various frequencies between each experimental group and untrained age-matched controls. YA-T group: n = 4, recorded sites = 212; OA-T: n = 4, recorded sites = 209; YA-Tdelay: n = 4; recorded sites = 192; OA-Tdelay: n = 4; recorded sites = 203; OA-Tdelay(DZP): n = 4; recorded sites = 189. Values shown are mean ± SEM, t test, two-way ANOVA with Tukey–Kramer correction.

