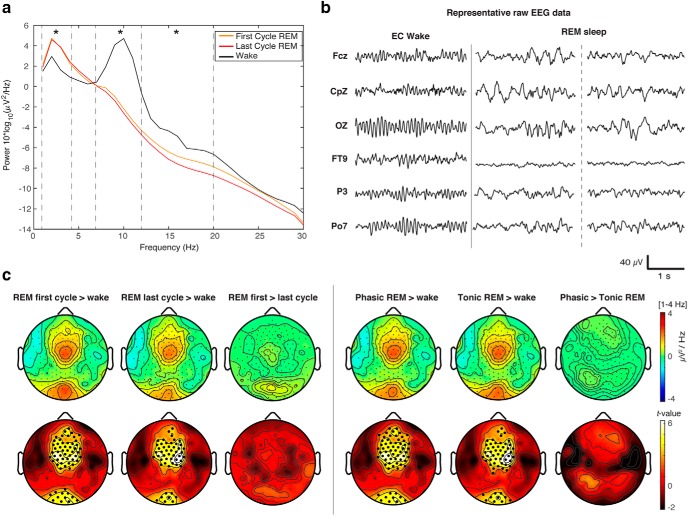
Figure 1.
A, Global PSD for the first and last cycle of REM sleep and quiet wakefulness. Group average global power spectra (average of all 185 EEG sensors) separated by state (wake (black line), the first cycle of REM sleep (orange line), and the last cycle of REM sleep (red line). Asterisks indicate significant differences between conditions (p < 0.05; repeated measures ANOVA) for δ (1–4 Hz), θ (4–7 Hz), α (8–12 Hz), and β (12–20 Hz) frequency bands. B, Representative EEG data across scalp regions for eyes-closed (EC) wakefulness and REM sleep. Central region: Fcz, CpZ; occipital region: OZ; other regions: frontotemporal (FT9), parietal (P3, Po7). C, Topography of REM sleep δ power. Left panel, Topographical differences in δ power [1–4 Hz] in the first and last cycle of REM sleep contrasted with wake. Right panel, Topographical differences in δ power [1–4 Hz] in phasic and tonic REM sleep contrasted with wake. Bottom row, t values for all electrodes (two-tailed, paired t test); black dots indicate significant differences between states (p < 0.05) after correcting for multiple comparisons with SNPM cluster size test.

