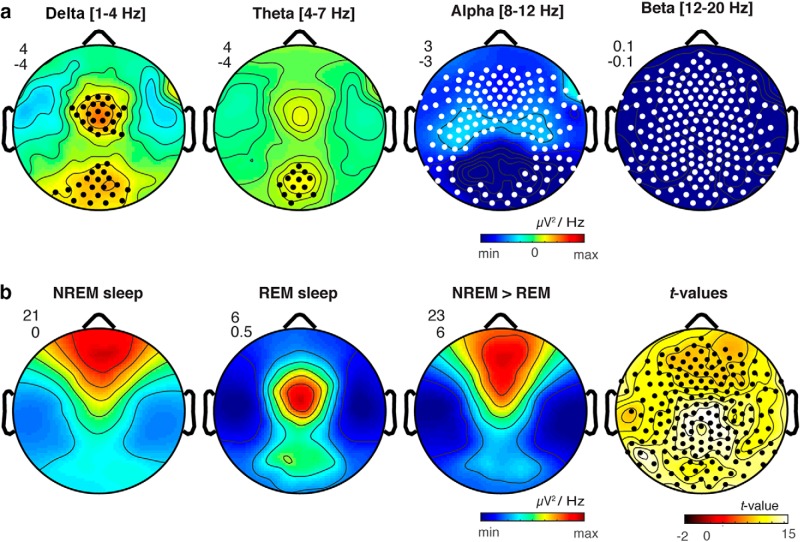
Figure 4.
A, Replication study. Scalp topography of differences in oscillatory power between REM sleep contrasted with wakefulness in a replication sample (N = 33) for δ (1–4 Hz), θ (4–7 Hz), α (8–12 Hz), and β (12–20 Hz) frequency bands. Black dots indicate significantly increased power in REM sleep compared to wakefulness; white dots indicate significant decreases in REM sleep compared to wakefulness (SNPM cluster corrected p < 0.05). B, Comparison of REM and NREM δ power. Scalp topography of δ power shown separately for NREM sleep, REM sleep, and NREM > REM sleep as well as t values for NREM > REM sleep δ power. The minimum and maximum values for each topographic map are plotted with the corresponding numeric range for the color scale shown in the upper left. Black dots indicate significantly increased power in REM sleep compared to wakefulness (SNPM cluster corrected p < 0.05).

