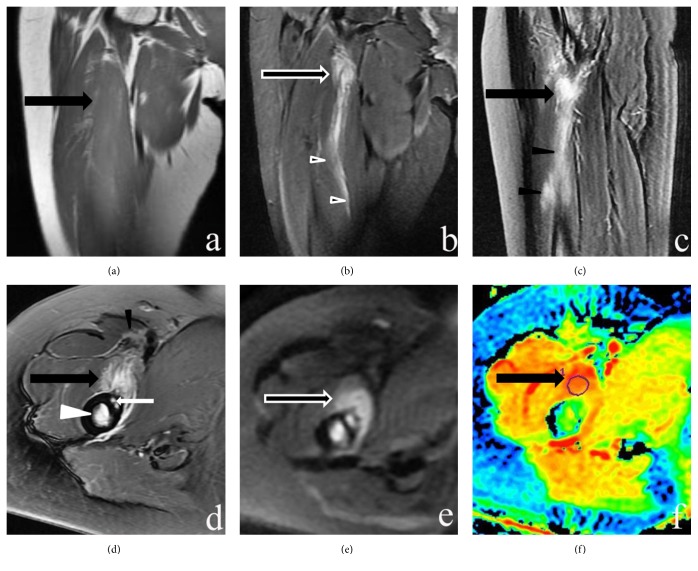
Figure 2.
MR imaging of the right thigh. (a) Coronal T1-weighted image shows an ill-defined isointense lesion in the iliopsoas muscle (large black arrow). (b-d) Sagittal, coronal, and axial fat-suppressed T2-weighted images reveal a hyperintense lesion with a “striate pattern” in the iliopsoas muscle (large black arrow) with a pattern of edema in the iliopsoas and sartorius muscles (black arrowheads). The femur bone shows bone marrow edema (white arrowhead). The femur periosteum displays patchy areas of hyperintensity in FSE T2WI images (small white arrow). (e and f) Axial DWI and ADC mapping display hyperintensity in DWI and high ADC values of the lesion, which indicate a T2 shine-through effect.

