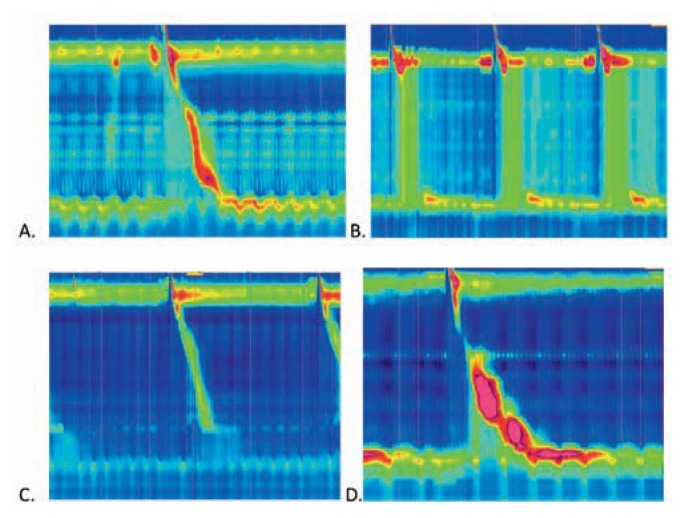
Figure 3.
High resolution manometry images demonstrate the pressures along the length of the esophagus (vertical axis) over time (horizonal axis) after swallows in the setting of common abnormalities. A. Normal esophageal manometry with normal progression of the pressure wave over time; B. Manometry in achalasia type II (classic achalasia) shows a lack of a normal peristaltic pressure wave; C. Manometry demonstrating weak lower esophageal sphincter (LES) tone that predisposes to GERD; D. Manometry demonstrating esophagogastric junction outflow obstruction (EGJOO) due to abnormally high pressures. Photo credit: Charlene Prather, MD, Division of Gastroenterology and Hepatology, Saint Louis University School of Medicine.

