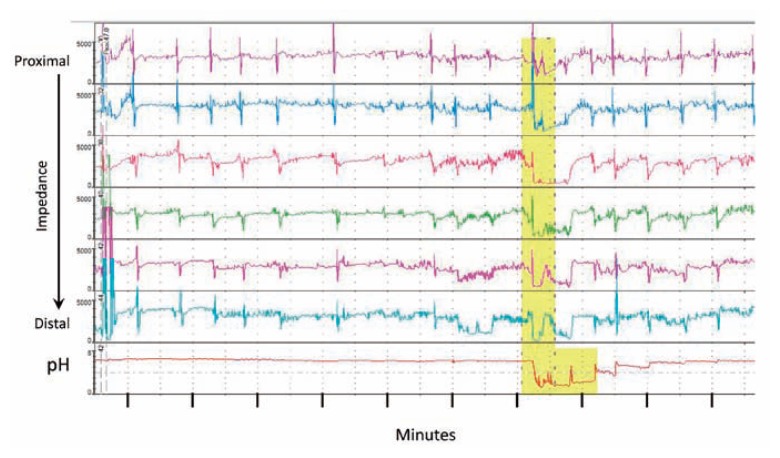
Figure 2.
High resolution esophageal impedance and pH tracings. Impedance (measure of electrical conductance) within the lumen of the esophagus is measured simultaneously using multiple probes and the measurements are displayed with the proximal measures at the top progressing distally towards the stomach. The bottom tracing is the pH at the most distal measurement point. Highlighted in yellow are measurements that document liquid reflux from the stomach correlating with a drop in pH indicating reflux of gastric acid. this tracing is a small snapshot of 24 hours of data.

