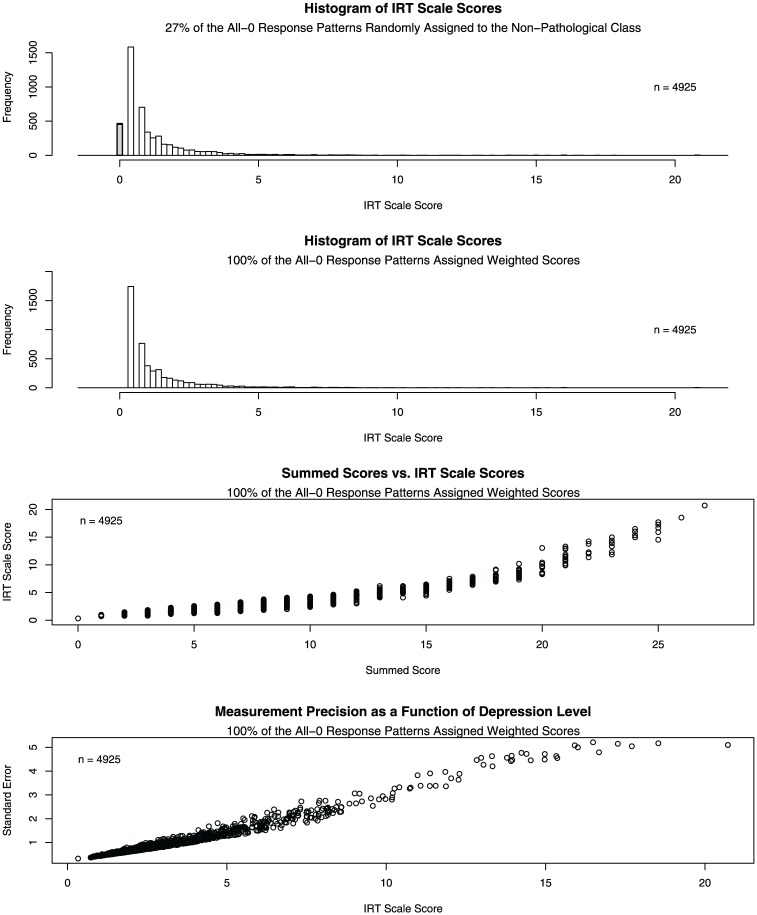
Figure 4.
IRT scale scores and summed scores for the PHQ-9
Note. Upper panel: Histogram of IRT scale scores computed from the zero-inflated UIRM with a log-normal prior, where 27% of the all-0 response patterns are randomly assigned to the nonpathological class; gray histobar shows scores for members of the nonpathological class. Second panel: Histogram of IRT scale scores computed from the zero-inflated UIRM with a log-normal prior, where all of the all-0 response patterns are assigned a weighted score based on the probability of class membership. Third panel: IRT scale scores as a function of summed scores. Lower panel: Posterior standard deviations (standard errors) as a function of IRT scale scores. IRT = item response theory; UIRM = unipolar item response models.

