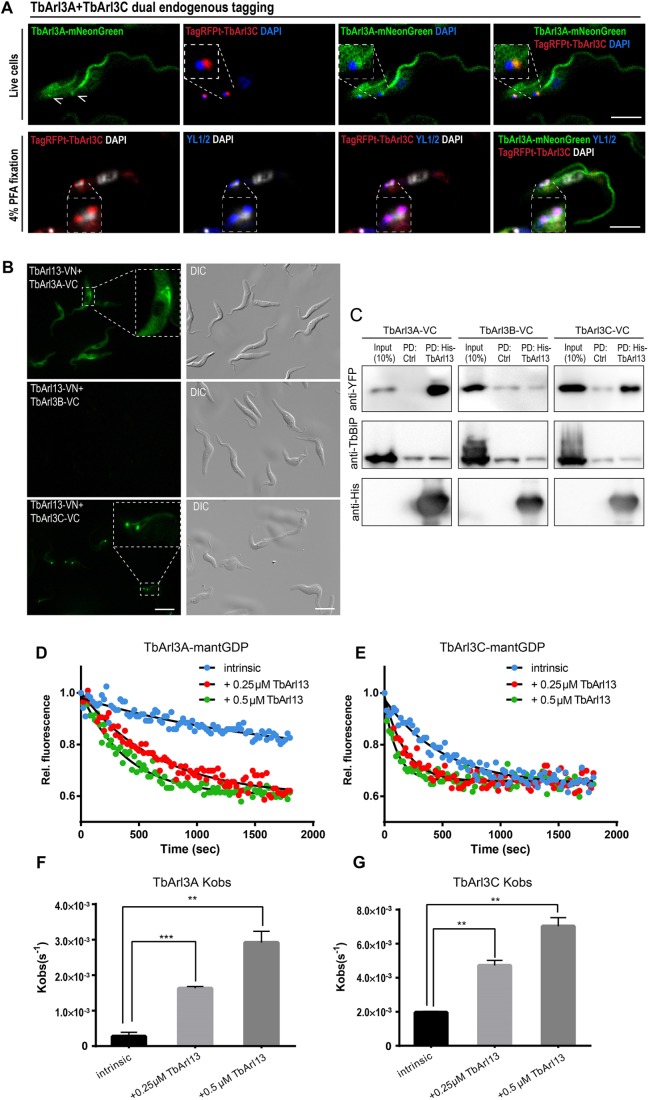
Fig. 5.
TbArl13 interacts with two differentially localized Arl3 homologs. (A) Cells co-expressing TbArl3A–mNeonGreen and TagRFPt–TbArl3C, both endogenously tagged, were imaged live (upper panel) or after 4% PFA fixation (lower panel). Kinetoplast and nuclear DNA were stained by cell-permeable DAPI. The YL1/2 antibody was used to mark the basal bodies (arrowheads). Scale bars: 5 μm. (B) Live PCF cells co-expressing TbArl13-VN and TbArl3A-VC (top), TbArl3B-VC (middle) or TbArl3C-VC (bottom) were imaged using fluorescence microscopy. Insets display enlarged regions exhibiting BiFC. Scale bars: 10 μm. (C) His–TbArl13-coated beads or control beads were able to pulldown (PD) TbArl3A- and TbArl3C-VC, but not TbArl3B-VC (all labeled by anti-YFP antibody). Anti-TbBiP was used as a control for non-specific binding to the beads. (D,E) TbArl13 accelerates dissociation of mant-GDP from both TbArl3A and TbArl3C, after the addition of unlabeled GTP at t=0 s. (F,G) Quantification (mean±s.e.m.) and statistical analysis of Kobs derived from results as shown in D and E. Experiments were replicated four times (n=4) for TbArl3A, and three times (n=3) for TbArl3C. **P<0.01, ***P<0.001 (two-tailed Student's t-test).

