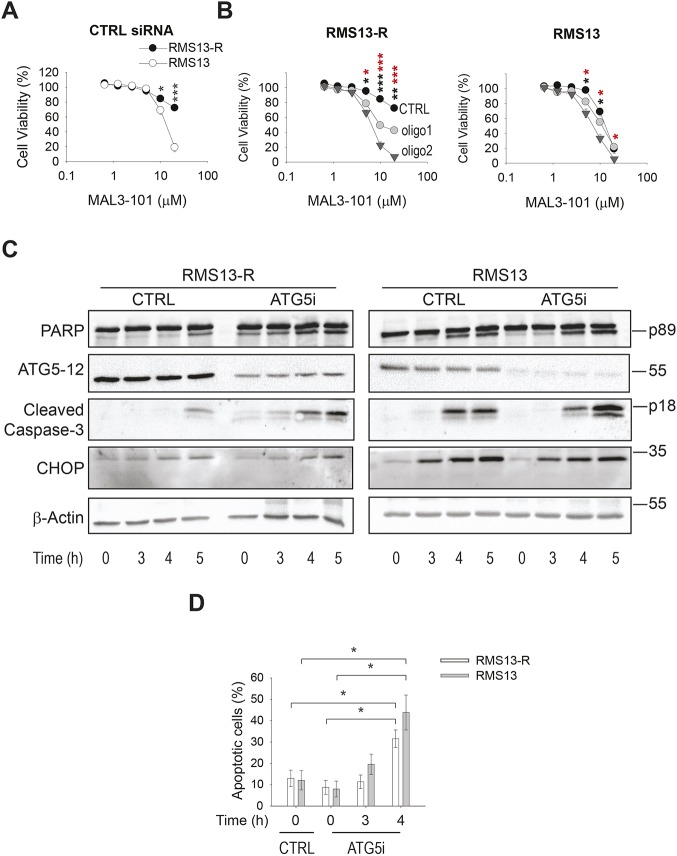
Fig. 6.
Autophagy inhibition induces MAL3-101-dependent cell death in RMS13-R cells. (A) RMS13-R and RMS13 cells were transfected with a control siRNA (CTRL), seeded into a 96-well plate, and treated with increasing doses of MAL3-101 for 24 h. Viability was assessed 72 h after transfection with the CellTiter-Glo assay. The mean±s.e.m. of three independent experiments are shown. (B) RMS13-R and RMS13 cells were transfected with a control siRNA (black) or with 2 different siRNA oligonucleotides directed against ATG5 (gray circles and inverted triangles). The mean±s.e.m. of three independent experiments are shown. Black asterisks correspond to the statistical significance between the control and oligonucleotide 1, and red asterisks represent the statistical significance between the control and oligonucleotide 2. (C) RMS13-R and RMS13 cells were transfected with a control siRNA or a mixture of the oligonucleotide 1 and oligonucleotide 2 ATG5 siRNAs and 70 h after transfection the cells were treated with 7.5 µM MAL3-101 for the indicated times. Lysates from cells prepared at each time point were immunoblotted for cleaved PARP, ATG5-12, cleaved caspase-3, and CHOP to monitor apoptotic induction. (D) RMS13 (gray) and RMS13-R (white) cells were transfected with control or a mixture of siRNA oligonucleotides 1 and 2 directed against ATG5, and 70 h after transfection the cells were treated with 7.5 µM MAL3-101 or with DMSO for the indicated times. Cells from each time point were stained for annexin-V and PI to monitor apoptosis. The sum of annexin-V-positive and annexin-V and PI double-positive cells is represented in the graph as the percentage of apoptotic cells. The mean±the range of the data are shown for two independent experiments. *P<0.05, **P<0.005, ***P<0.0001.

