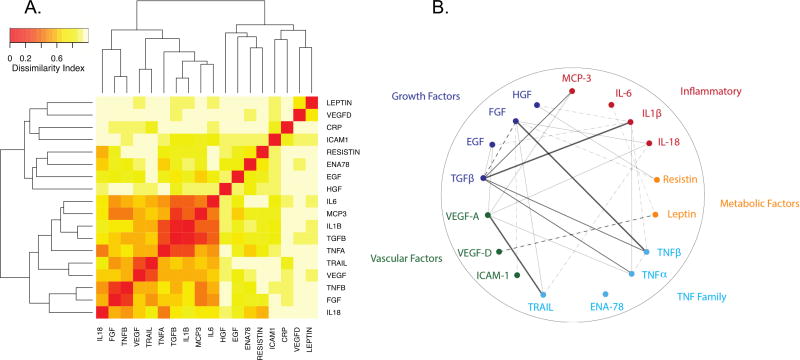
Figure 2. Correlation matrix plot and Partial correlation diagram between cytokines.
Selected cytokines based on the associations emerged from the PLS analyses and literature were used to create a (A) correlation matrix plot and a (B) partial correlation diagram. (A) The matrix plot was created using a dissimilarity matrix of 1-abs(correlation) and heatmap.2 function in R with hierarchical clustering with r values for individual correlations plotted in color grade. Highly co-regulated pattern of expression is found among the cytokines. (B) Multiple pathways appear to be involved in ventricular remodeling, and these pathways correlated with each other. All lines represent statistically significant partial correlations (p<0.05). The full lines represent direct correlations and dashed lines show inverse correlations. Thicker lines show stronger relationship (r>0.18: very pale line, r>0.30: thin, r>0.50, normal caliber line, r > 0.70: very thick thin).

