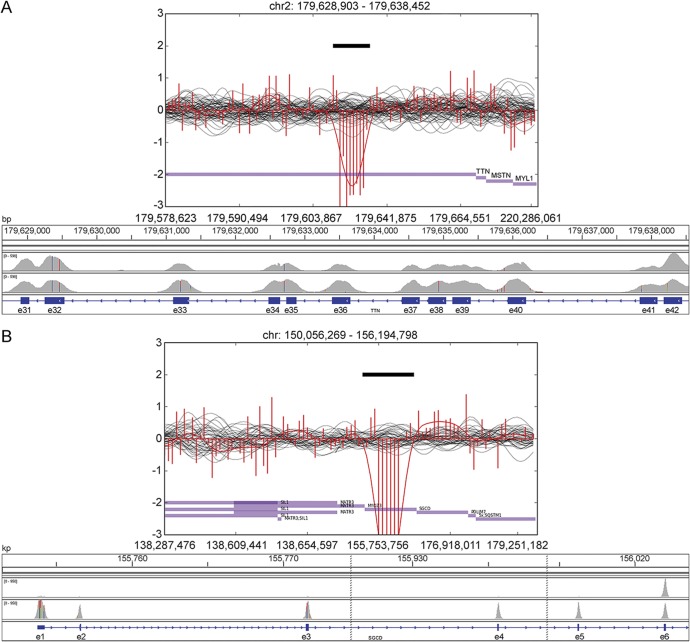
Figure 1. Visualizations of copy number variants of patients IIa and IIIa.
CoNIFER visualizations of a heterozygous deletion in the TTN in patient IIa (A) and a homozygous deletion in the SGCD in patient IIIa (B) accompanied with corresponding regions visualized with Integrative Genomics Viewer (IGV). In CoNIFER visualizations, the red line corresponds to the read depths for sample with deletion and black lines correspond to control samples. In the IGV visualization, the first row shows the sample with deletion and the second row shows a control sample without deletion.

