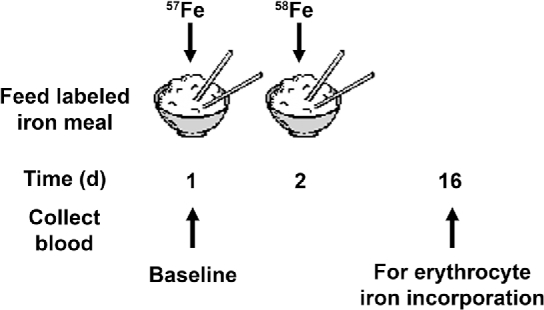
FIGURE 5.

Design used for iron bioavailability studies to compare the quantities of iron absorbed and used between 2 test meals (based on references 97†, 98†, and 99). Two blood samples are required to determine the incorporation of the isotopes into the erythrocytes. After sample preparation, the iron is analyzed with an appropriate mass spectrometer and ratios of the stable isotopes are compared before and after dosing to determine the amount of iron incorporated into the RBCs. † following a citation number indicates a work that the International Atomic Energy Agency has supported on stable isotopes.
