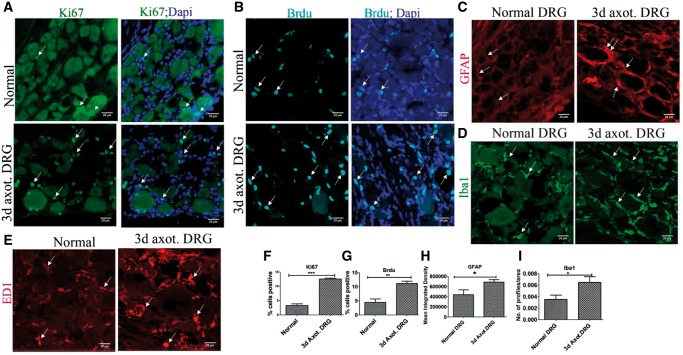
FIGURE 1.
DRCCs in normal and injured DRG. (A) Expression of Ki67 (arrows) in normal and axotomized DRGs indicates proliferation of resident cells in the DRGs. (B) Brdu incorporation (arrows) in normal and axotomized DRGs indicates generation of new cells in the DRGs. (C) GFAP expression (arrows) shows increased activation/turnover of SGCs in axotomized DRGs. (D) Iba1+ macrophages(arrows) increased accumulation in axotomized DRGs. (E) ED1+ macrophages (arrows) increased accumulation in axotomized DRGs. (F–I) Quantification of (A, B, C, D) showing increased expression of ki67, Brdu, GFAP, and Iba1, respectively, in 3-day axotomized DRGs. Ki67+ cell number is expressed as the percentage of total number of DAPI+ cells, n = 3 animals for each group, number of cells, 2681 for normal, 1786 for axotomized DRG, p = 0.0001, df = 4, ***p < 0.05 (Student t-test, two-tailed). Brdu+ cell number is expressed as the percentage of total number of DAPI+ cells, n = 3 animals for each group, number of cells, 2142 for normal, 2202 for axotomized DRG, p = 0.0098, df = 4, **p < 0.05 (Student t-test, two-tailed). GFAP levels are expressed as mean integrated intensity calculated using Image J after subtracting background signals in a total field area of 52355.3 µm2, n = 3/group, p = 0.0395, df = 4, *p < 0.05 (Student t-test, one-tailed). Iba1 profiles were measured using Image J threshold method and expressed as number of profiles/area, n = 3/group, p = 0.040, df = 4, *p < 0.05 (Student t-test, one-tailed). Scale bar: 25 µm.

