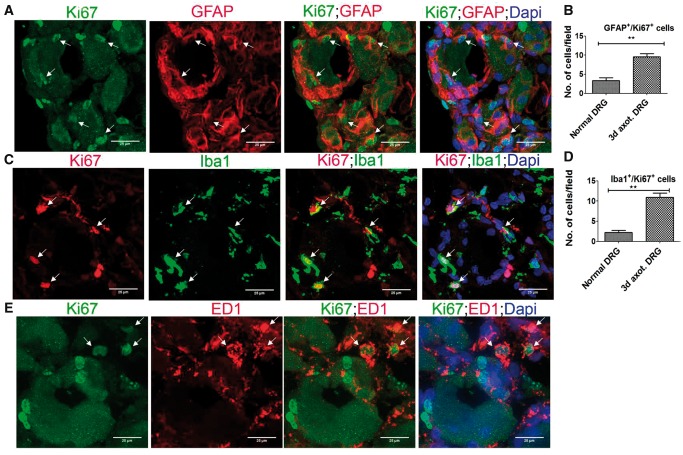
FIGURE 2.
Proliferation of SGCs and macrophages in axotomized DRG. (A, C, E) Co-expression of Ki67 and GFAP (A), Iba1 (C) or ED1 (E) indicates local proliferation of SGCs (A) and macrophages (C, E) in 3-day axotomized DRGs (Ki67+ cells expressing GFAP, Iba1 or ED1 are shown using arrows). Scale bar: 25 µm. (B) Quantification of (A) shows increased proliferation of SGCs in axotomized DRGs. The quantification was done using Image J software by counting the number of GFAP+/Ki67+cells in multiple fields of 52355.3 µm2 area in a given sample, n = 3/group, p = 0.0051, df = 4, **p < 0.05 (Student t-test, two-tailed). (D) Quantification of (C) shows increased proliferation of Iba1+ macrophages in axotomized DRGs. The quantification was done using Image J software by counting the number of Iba1+/Ki67+cells in multiple fields of 52355.3 µm2 area in a given sample, n = 3/group, p = 0.0017, df = 4, **p < 0.05 (Student t-test, two-tailed).

