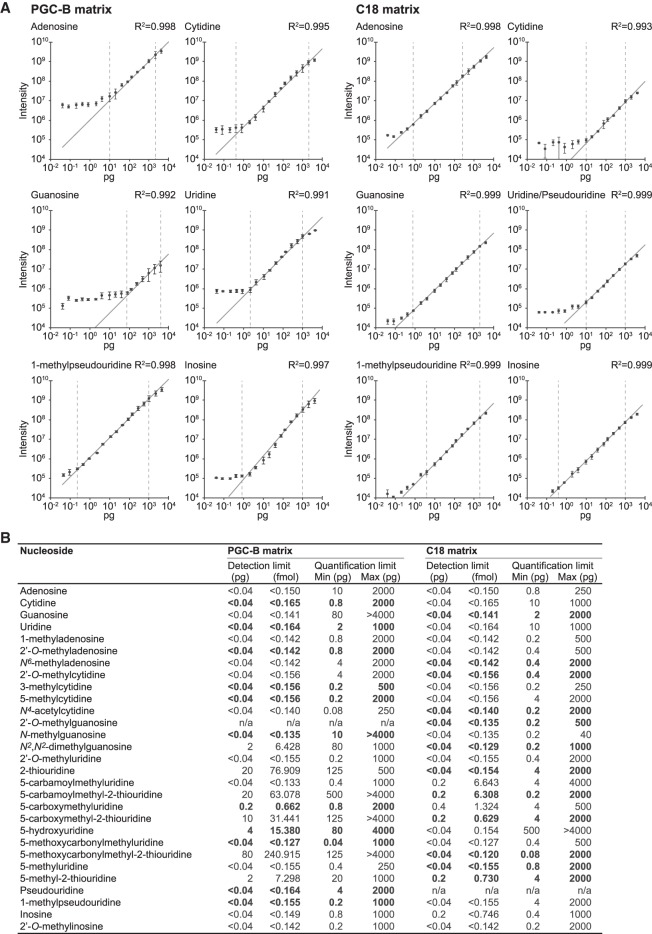
FIGURE 5.
Absolute quantification can be accomplished over a broad detection range. (A) Calibration curves for representative ribonucleosides analyzed on PGC-B (left panels) and C18 matrices (right panels) showing the observed XIC maximum intensity as a function of sample loaded (0.04–4000 pg). The error bars represent the standard deviation for each data point (n = 3). Linear regression (dark gray line) is used to determine the dynamic range of the instrument for each ribonucleoside on the respective matrix by observing the range at which a linear dependency between input amount and intensity is observed (vertical dashed bars indicate the range). (B) Summary of the linear quantification range determined for all 31 ribonucleosides present in the CSM (linear regression for all moieties is R2 ≥ 0.96). The matrix that provides the best overall performance (detection limit, quantification range, R2-value)—and is the recommended choice for analyzing the selected ribonucleoside—is highlighted in bold.

