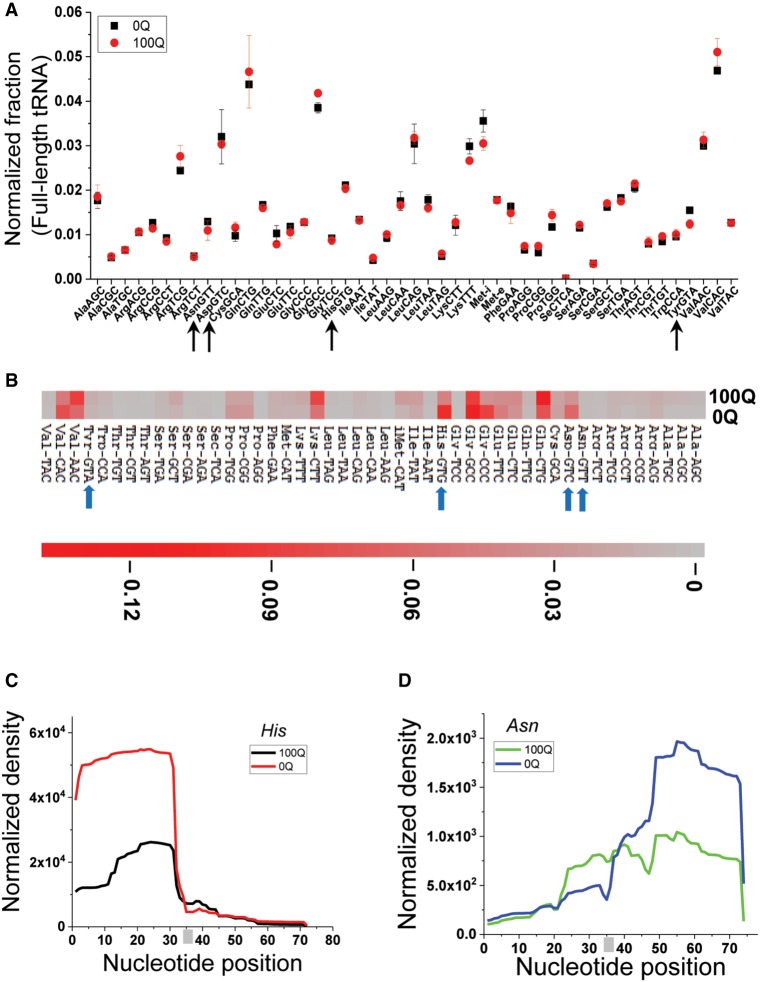
FIGURE 2.
Q modification and tRNA fragments in vivo by RNA-seq. (A) Comparison of the tRNA isoacceptor family abundance of 0Q and 100Q HEK293T cells by DM-tRNA-seq. Arrows indicate the four Q-modified cognate tRNAs. The total number of assigned tRNA reads is set to 1 in each sample, and the fraction of each tRNA isoacceptor is shown. (B) Heatmap of tRNA fragment abundance at the isoacceptor family level. The amount of all tRNA fragment products of all sizes in each sample are added together and set as 1; shown are the fractions of individual tRNA isoacceptors. Arrows indicate the four Q-modified cognate tRNAs. The scale bar shows the fraction tRNA fragments in the heatmap. (C,D) tRNAHis and tRNAAsn fragment coverage from 0Q and 100Q HEK293T cells. The anticodons (GTG for tRNAHis, and GTT for tRNAAsn) are indicated by a gray bar.

