
FIGURE 5.
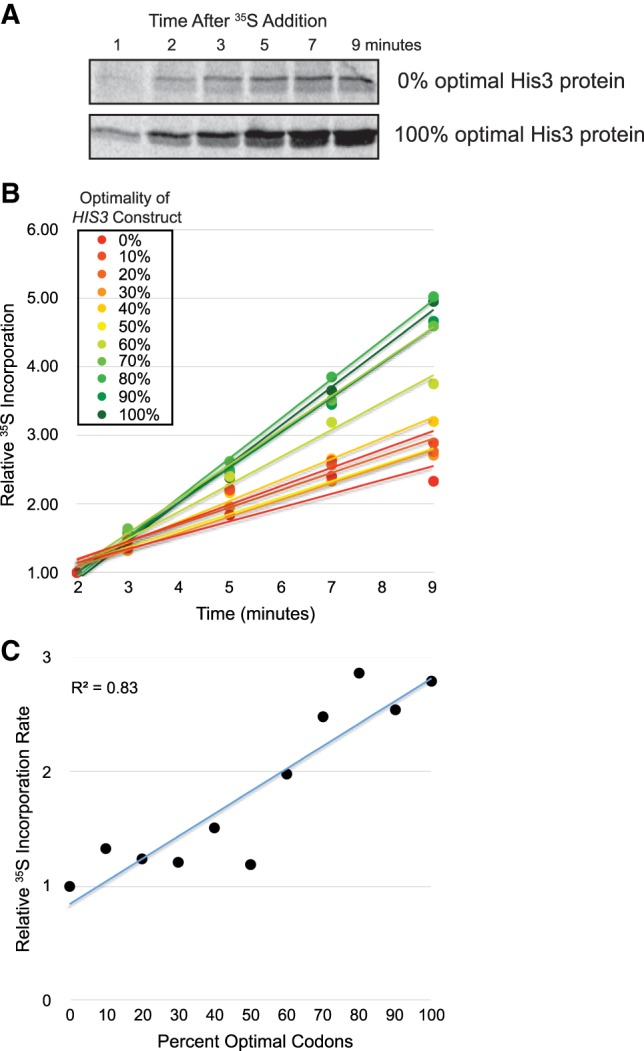
Codon optimality contributes to the rate of His3 protein production during 35S-methionine/cysteine labeling. (A) A representative image showing levels of 35S-methionine/cysteine-labeled His3 protein at each time point following addition of 35S-methionine/cysteine to S. cerevisiae cells at mid-log phase. His3 protein expressed from the 0% and 100% optimal HIS3 constructs is presented. (B) Graphical representation of the increase in 35S-methionine/cysteine-labeled His3 protein abundance over time, relative to the protein abundance at the 2 min time point, for each of the 0%–100% optimal HIS3 constructs. (C) The slope of each curve in Figure 5B, normalized to the slope for the 0% optimal construct, is plotted as a measure of the relative rate of 35S incorporation per minute for each HIS3 construct.