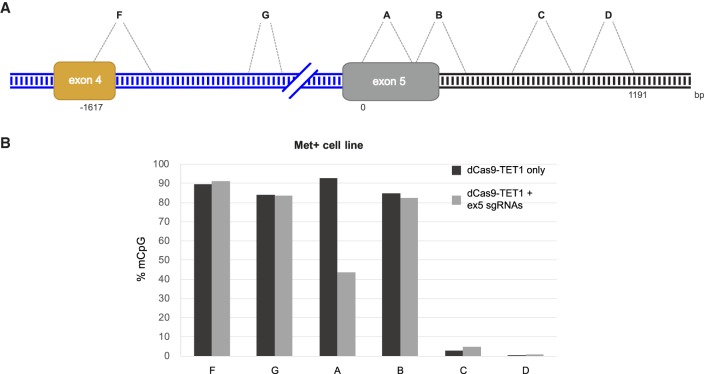
FIGURE 3.
dCas9-TET1 induces DNA demethylation in a limited region. (A) Schematic illustration of EDI minigene exons 4 and 5. Exon 4 is alternatively spliced, whereas exon 5 is constitutively spliced. Blue and black lines indicate EDI introns and pFRT sequence, respectively. The six regions analyzed for methylation are indicated with letters. (B) The level of methylated CpGs (in percent) within the six regions denoted in panel A after transfection of dCas9-TET1 plasmid into Met+ cells with or without sgRNA expression (black and gray bars, respectively).

