Fig. 5.
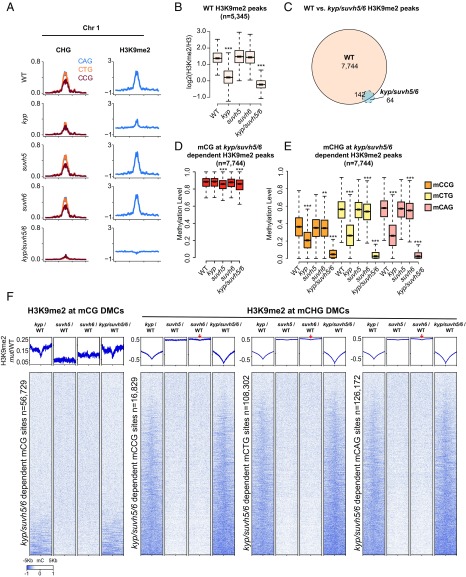
Interdependent H3K9me2 and DNA methylation defects in kyp, suvh5, suvh6, and kyp/suvh5/6. (A) Chromosomal distribution of CHG (mCAG, mCGG, and mCTG) methylation and log2 ratio of H3K9me2/H3 in WT, kyp, suvh5, suvh6, and kyp/suvh5/6 in chromosome 1 (bin = 100 kb). (B) Boxplot of log2 ratio of H3K9me2/H3 levels, at WT defined H3K9me2/H3 peaks (using callpeak function in MACS2), in WT, kyp, suvh5, suvh6, and kyp/suvh5/6. ***P value <2.2e−16, **P value <1e−8 with Student’s t test. (C) H3K9me2/H3 peak overlap defined by comparison between WT and kyp/suvh5/6 (using bdgdiff in MACS2). (D) Boxplot for CG methylation levels in WT, kyp, suvh5, suvh6, and kyp/suvh5/6 at kyp/suvh5/6-dependent H3K9me2/H3 peaks [defined by H3K9me2 peaks called in WT but not in kyp/suvh5/6 (n = 7,744), see C]. ***P value <2.2e−16, **P value <1e−8 with Student’s t test. (E) Boxplot for CHG methylation (mCCG, mCTG, and mCAG) levels of kyp/suvh5/6-dependent H3K9me2/H3 peaks in WT, kyp, suvh5, suvh6, and kyp/suvh5/6. ***P value <2.2e−16, **P value <1e−8 with Student’s t test. (F) Heatmap of normalized H3K9me2 levels in kyp/WT, suvh5/WT, suvh6/WT, and kyp/suvh5/6/WT plotted over kyp/suvh5/6-dependent CG and CHG sites (mCCG, mCTG, and mCAG). Red arrows indicate H3K9me2 depletion in suvh6 centered on DMCs.

