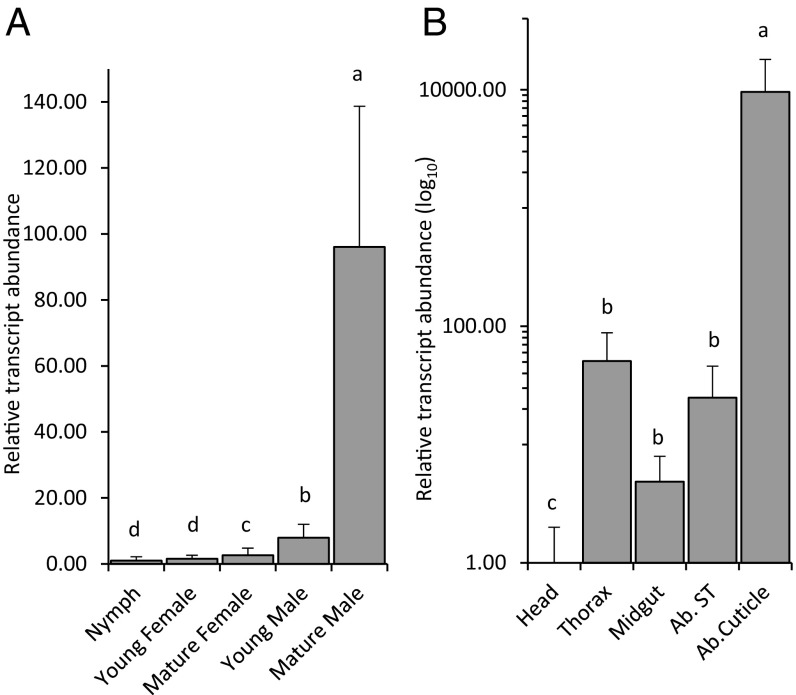
Fig. 2.
Relative transcript abundance of MhTPS in M. histrionica determined by qRT-PCR. (A) MhTPS transcript abundance at different developmental stages and in different sexes. Young is 3-d adult; mature is 15-d adult. (n = 3, ±SD). (B) MhTPS transcript abundance in different tissues of adult males. Ab. Cuticle, tissue lining the abdominal cuticle; Ab. ST, Abdominal soft tissue minus midgut. (n = 3, ±SD). Gene expression was normalized against 18S rRNA. Transcript abundance is shown relative to that in nymphs (A) or the male head tissue (B) (set to 1). Significance was determined using one-way ANOVA and means grouped by Tukey’s honestly significant difference test.

