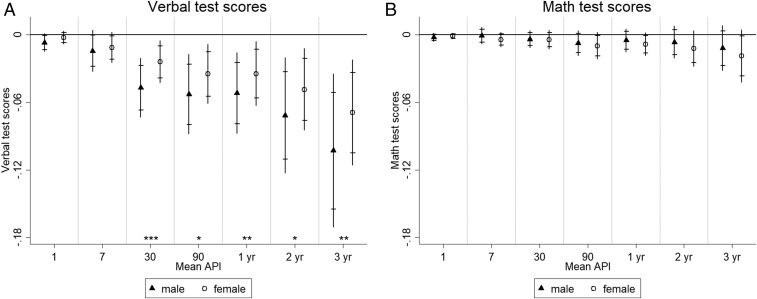
Fig. 1.
The figures plot the estimated coefficients on air pollution for the male and female subsamples with 95% and 99% confidence intervals based on the estimates in SI Appendix, Tables S2a and S2b. A and B refer to verbal and math test scores, respectively. Air pollution data are matched between each CFPS county centroid and its nearest API reporting city boundary within a radius of 40 km (i.e., 25 miles). The asterisks in the figure indicate the significance of the male–female difference denoting the results of Wald tests: *10% significance level; **5% significance level; ***1% significance level.

