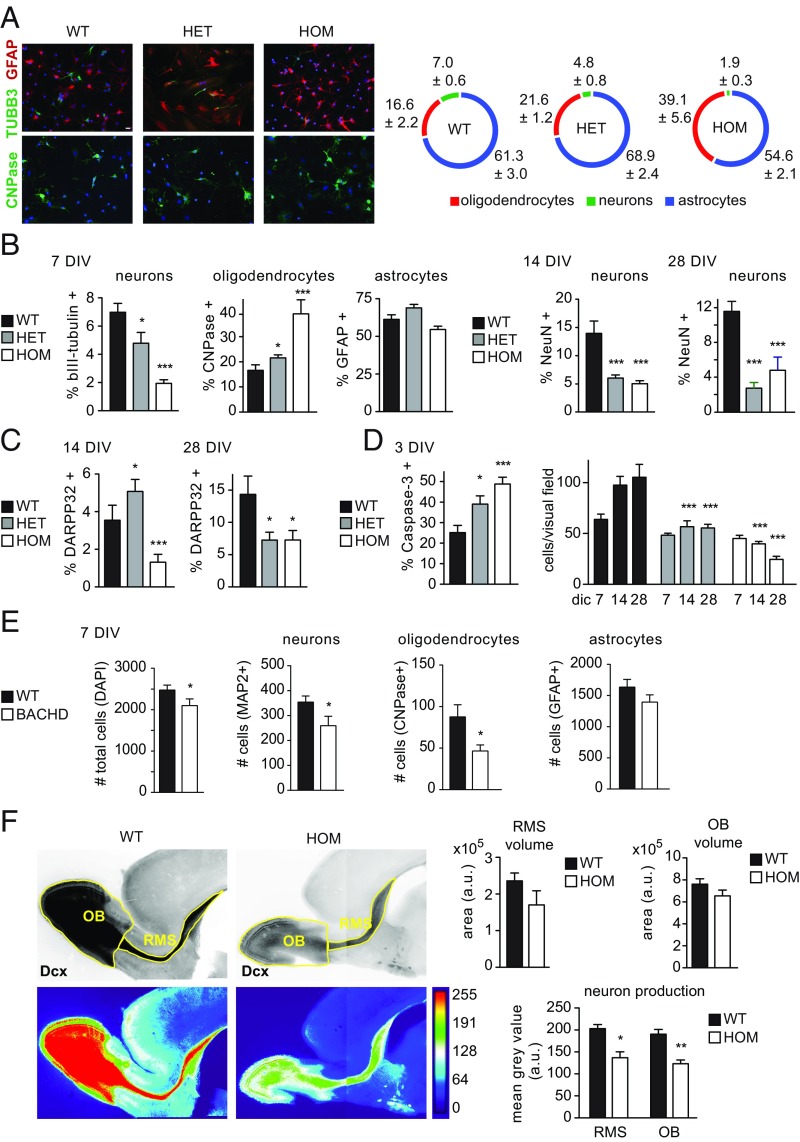
Fig. 3.
(A, Left) Cellular analysis of tgHD P10 neurogenesis. Quantitative analysis of P10 rat neurosphere differentiation demonstrated reduced neuronal (bIII tubulin, green, Upper) and increased oligodendroglial (CNP, green, Lower) differentiation, while astroglial (GFAP, red, Upper ) fates were unaffected (Scale bar, 20 µm applies to all images.). (Right) Graphical representation indicates percentages ± SEM of individual cell types. (B) After 7 d in vitro (DIV) differentiation, neuron numbers were significantly decreased, while oligodendrocyte counts were increased. Astrocyte numbers were not affected significantly. Numbers of mature, NeuN-expressing neurons were significantly reduced at 14 DIV and 28 DIV. (C) Similarly, DARPP32+ cell counts were significantly reduced at both time points. (D) The differentiation phenotype was accompanied by an increase in apoptosis, which is reflected in lower cell counts after differentiation. In A–D: ANOVA; n = 3 independent experiments with 10 replicates. (E) Differentiation of BACHD embryonic (E13.5) neurospheres revealed significantly lower numbers of total cells and MAP2+ and CNPase+ cells compared with WT cultures (ANOVA; n = 8). GFAP+ astrocyte counts were unchanged. (F) In vivo changes in neuronal differentiation are reflected in the RMS and OB of P10 Dcx-dsRed2-tgHD double transgenic pups (Mann–Whitney U test, n = 7). (Upper Left) Inverted fluorescence images. (Lower Left) Heatmaps of fluorescence intensity. (Right) While the volume of RMS and OB was not significantly different, the mean fluorescence intensity (proportional to neuronal numbers) was significantly reduced in both structures. Data represent means ± SEM. *P < 0.05; **P < 0.01; ***P < 0.001.

