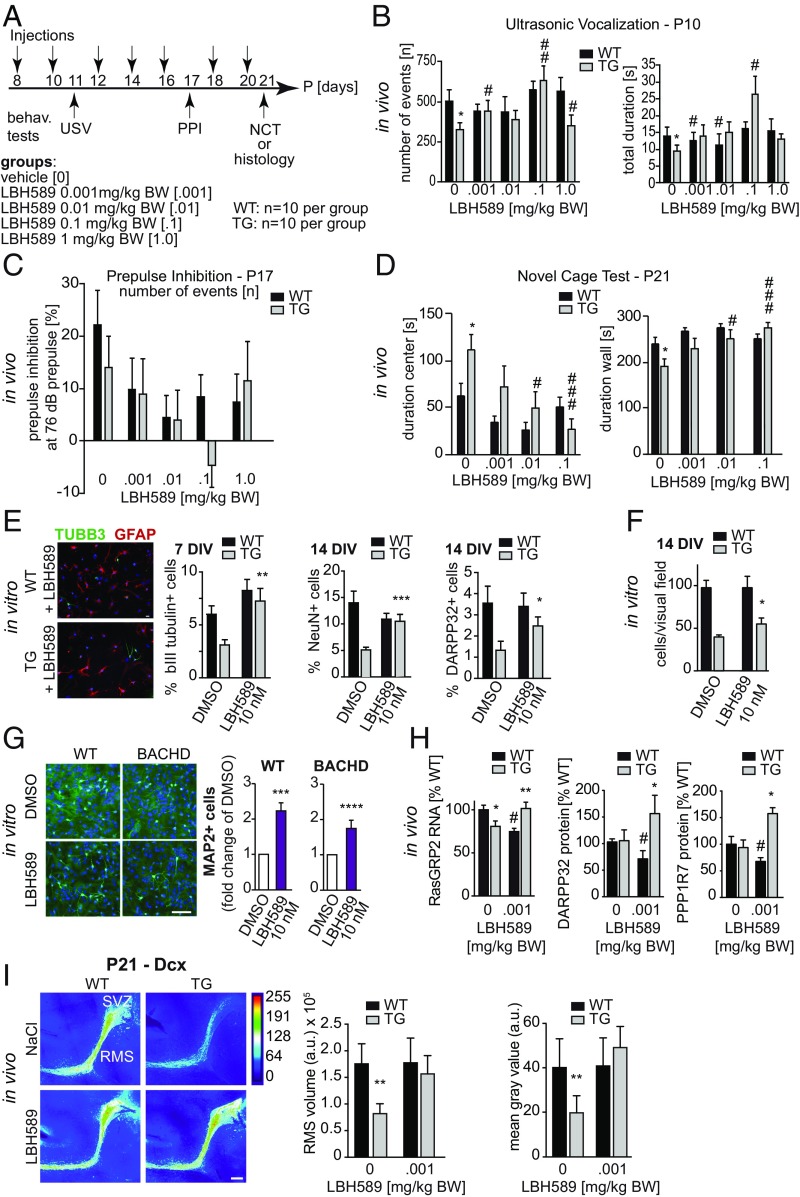
Fig. 4.
(A) Treatment of early phenotype using HDAC inhibitor LBH589. tgHD HOM pups and WT controls were treated with the HDACi LBH589 from P8 to P20 (n = 10 each). Behavioral readouts were USV (P11), startle response and PPI (P17), and NCT (P21). Four different doses (0.001, 0.01, 0.1, and 1.0 mg/kg body weight) were administered i.p. every other day. (B) The numbers of ultrasonic calls were significantly increased in transgenic animals treated with LBH589 compared with vehicle controls. The increase in the total duration in transgenic animals did not reach significance except for the 0.1 mg/kg group (0.001 mg/kg: P = 0.2561; 0.01 mg/kg: P = 0.1949; 0.1 mg/kg: P = 0.0016; ANOVA; n > 10). (C) PPI was suppressed in animals treated with LBH589 in all doses tested compared with WT (ANOVA; n > 3). (D) LBH589 treatment significantly decreased the time spent in center areas and increased the time spent in wall areas in transgenic rats compared with corresponding vehicle-treated transgenic animals (ANOVA; n > 4). LBH589 had no significant effect on WT animals. (E) LBH589 treatment of differentiating neurosphere cultures restored tgHD HOM neuron numbers to WT levels. Shown are representative images of cultures treated with 10 nM LBH589 for 24 h. (Scale bar, 20 µm in both images.) TuJ+ neurons were counted after 7 d, and NeuN+ and Darpp32+ neurons were quantified after 14 d. TuJ+, NeuN+, and Darpp32+ cells were within the range of WT cultures (ANOVA; n = 3 independent experiments with 10 replicates). (F) LBH589 treatment resulted in increased cell counts in transgenic but not in WT cell cultures. (G, Right) The percentage of MAP2-immunopositive neurons was significantly increased with 10 nM LBH589 in WT and BACHD E13.5 neurosphere cultures (ANOVA; n = 8). (Left) A representative photomicrograph showing MAP2+ neurons (green) and DAPI (blue) from WT and BACHD cultures. (Scale bar, 100 µm.) (H) LBH589 treatment (0.001 mg/kg) increased striatal RasGRP2 gene expression and DARPP32 and PPP1R7 protein levels in P10 tgHD pups but not in WT littermates (ANOVA; n > 6). (I, Left) Heatmaps of dcx-stained immunofluorescence micrographs from P21 tgHD pups highlight SVZ–RMS neurogenesis in vivo. (Scale bar, 100 µm.). (Right) LBH589 treatment restored both RMS volume and dcx fluorescence intensity in tgHD pups to WT levels (seven injections of 0.001 mg/kg compared with vehicle control; two-way ANOVA; n > 3). Data represent means ± SEM. Significant effects vs. WT (*P < 0.05; **P < 0.01; ***P < 0.001; ****P < 0.0001) and treatment effects vs. vehicle control (#P < 0.05; ##P < 0.01; ###P < 0.001).

