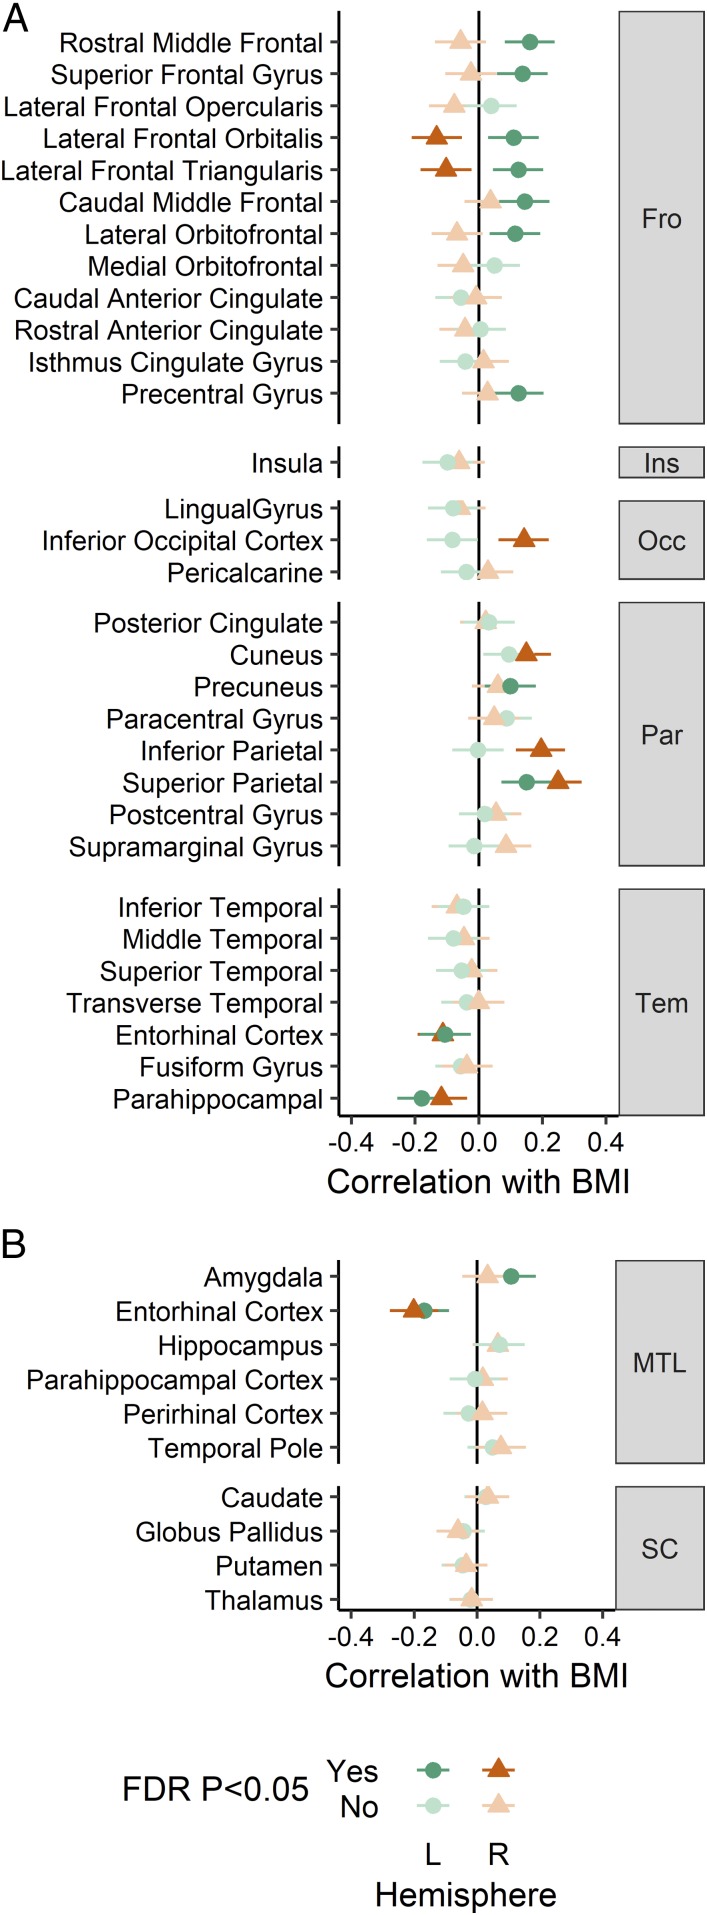
Fig. 2.
Associations between BMI and brain morphometry. (A) Cortical thickness. (B) Medial temporal and subcortical regional brain volume. Error bars represent 95% confidence intervals. Numerical values are reported in Dataset S1, section 2. FDR, false discovery rate; Fro, frontal, Ins, insula; L, left; MTL, medial temporal lobe; Occ, occipital; Par, parietal; R, right; SC, subcortical; Tem, temporal.

