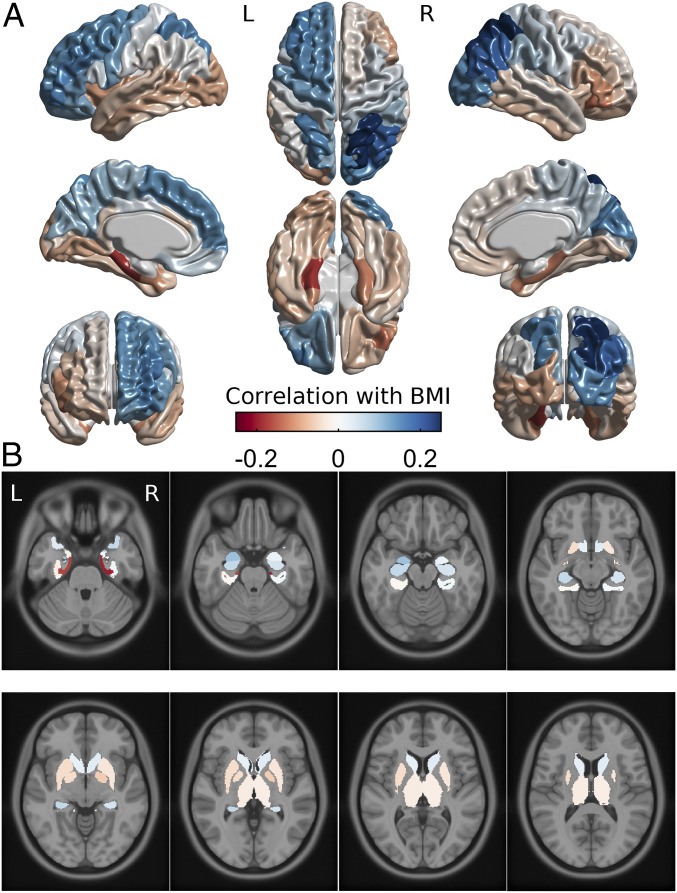
Fig. 3.
Brain maps of the associations between BMI and cortical thickness (A) and medial temporal and subcortical regional brain volume (B) on a standard brain template in Montreal Neurological Institute space. Values are the same as in Fig. 2. Color bar applies to both subplots. L, left; R, right.

