Fig. 3.
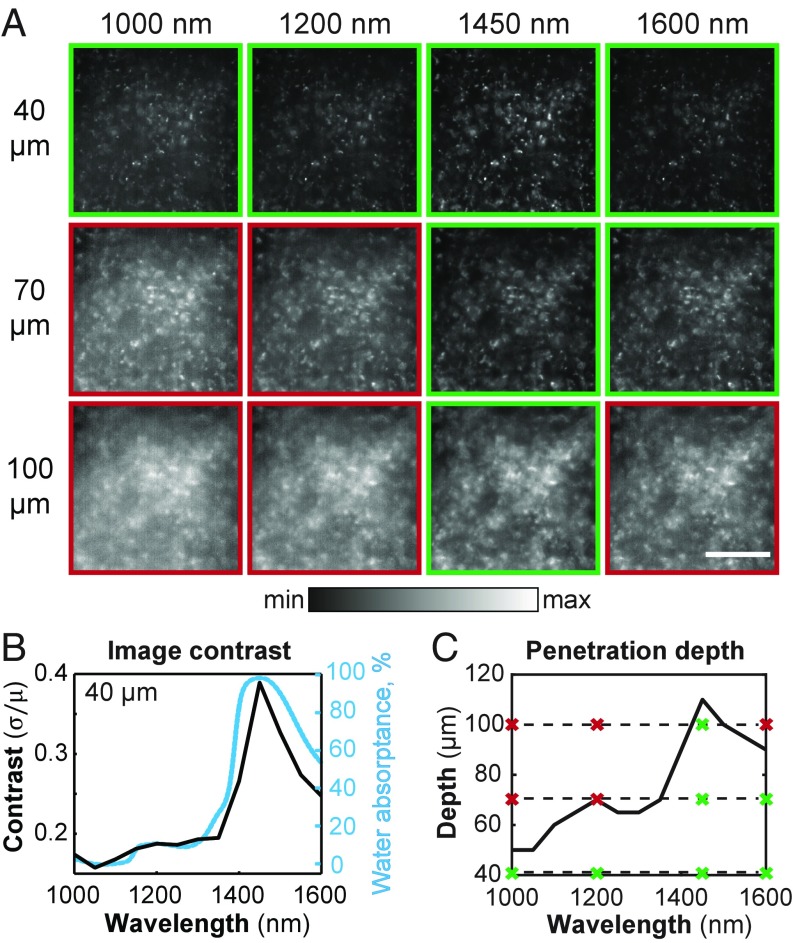
Contrast and penetration depth enhancement in microscopy of ex vivo liver tissue. (A) We labeled the Kupffer cells of a mouse liver using a broadly emitting quantum dot emulsion, and imaged the cells via microscopy with 50-nm band-pass emission filters centered across SWIR wavelengths, a subset of which are shown here at imaging depths of 40, 70, and 100 μm for 1,000-, 1,200-, 1,450-, and 1,600-nm filters. Integration times for all images are listed in SI Appendix, Table S1. All images are set to fill the maximum displayable intensities. (Scale bar, 200 μm.) (B) The contrast, (Eq. 1), was calculated and plotted as a function of wavelength (black line) for images taken at a depth of 40 μm. The contrast shows a similar trend to the water absorptance spectrum (blue line). (C) Furthermore, penetration depth was calculated using an algorithm adapted from Rowlands et al. (38) and plotted as a function of wavelength, showing a similar trend. The dashed lines mark the depths at which the images in A were taken, and the crosses display the wavelength positions. Green boxes and crosses indicate images considered to be resolvable within the contrast threshold.

