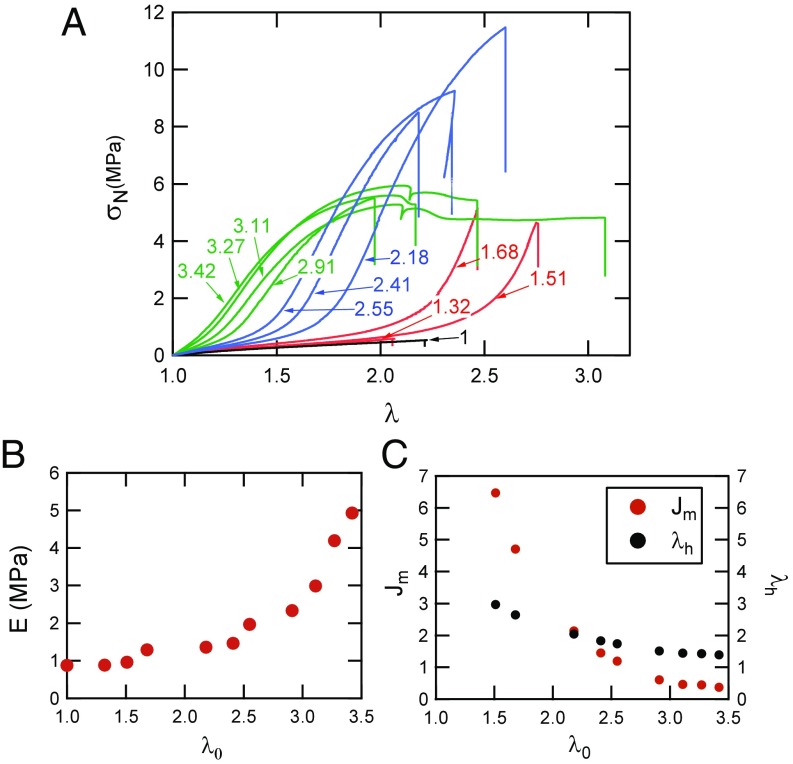
Fig. 2.
(A) Stress–strain curves of different composites EA (λ0) made from the same filler network. The value of λ0 is shown in the labels attached to each curve. The color corresponds to the number of polymerization steps: black, one; red, two; blue, three; and green, four. = 0.021 s−1 for all tests. (B) Young’s modulus as a function of the degree of prestretching λ0 of the filler network. (C) Evolution of Jm and λh obtained from the best fit to the Gent model as a function of λ0.

