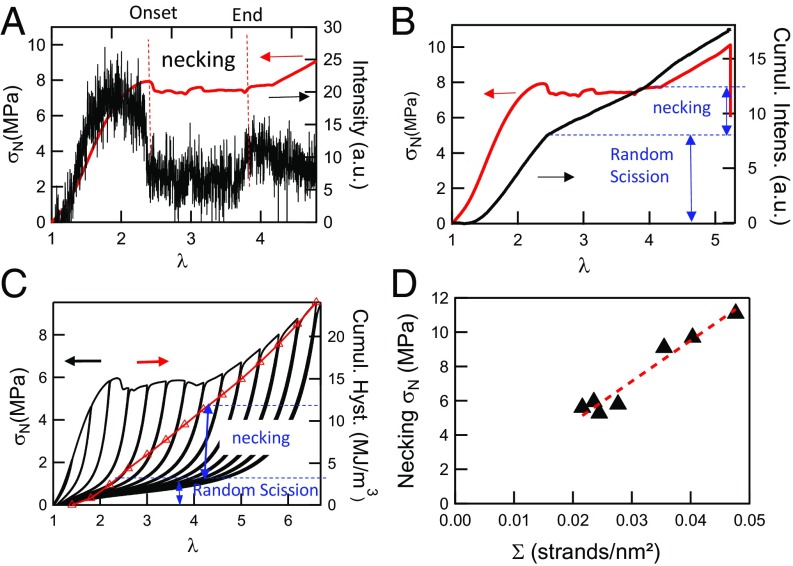
Fig. 6.
(A) Stress–strain curve (red line) and intensity of the mechanoluminescent signal (black line) as a function stretch for the sample EA(d20)0.73(2.94). (B) Cumulated intensity (black line) of the mechanoluminescent signal and nominal stress (red line) as a function of λ. (C) Cumulated mechanical hysteresis (red symbols) and nominal stress (black line) in a cyclic test carried out on the EA1.45(3.42) as a function of λ, along with the nominal stress. (D) Evolution of the necking stress as a function of the filler network’s areal density of strands.

