Fig. 7.
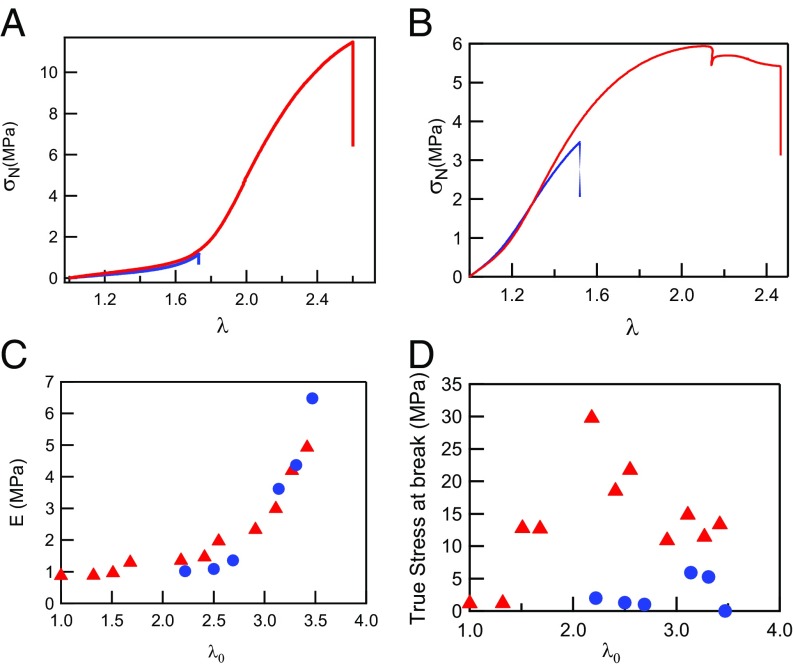
(A) Stress–strain curves of EA(1.68) swollen by DMSO to λ0 = 2.22 (blue line) in comparison with EA(2.18), a fully polymerized sample with a similar prestretching (red line). = 0.021 s−1. (B) Stress–strain curves of EA(2.53) swollen by MPD to λ0 = 3.31 (blue line) in comparison with EA(3.27), a fully polymerized sample with a similar prestretching (red line). = 0.021 s−1. (C) Evolution of the modulus as a function of λ0 for standard samples (red triangles) and for samples partially swollen in solvent (blue circles). (D) True stress at break as a function of λ0 for standard samples (red triangles) and for samples partially swollen in solvent (blue circles).

