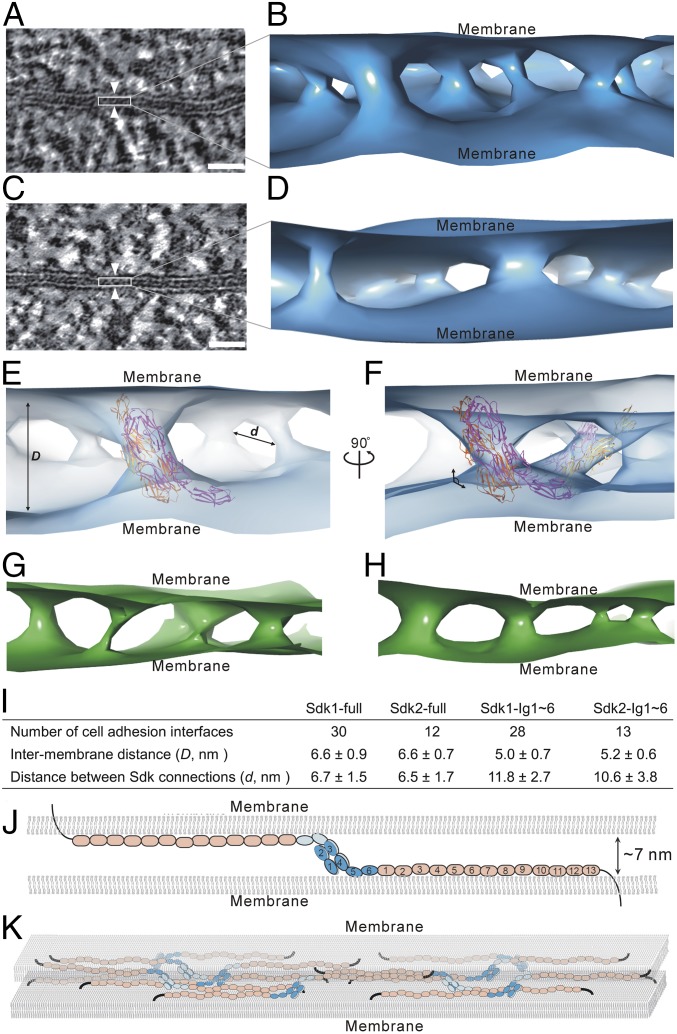
Fig. 5.
Architecture of Sdk-mediated cell–cell adhesion revealed by electron tomography. (A) A tomographic slice of a cell adhesion interface (white arrowheads) formed by Sdk1. (B) An isosurface of tomographic density showing the connections and organization of Sdk1 molecules between cell membranes. (C) A tomographic slice of a cell adhesion interface (white arrowheads) formed by Sdk2. (D) An isosurface of tomographic density showing the connections and organization of Sdk2 molecules between cell membranes. (E) Fitting of the crystal structure of Sdk1 Ig1∼5 homophilic dimer (magenta and orange; PDB ID code 5k6w) into the tomographic density (light blue) of Sdk1 in the adhesion interface. (F) Another view of the fitting of Sdk1 Ig1∼5 into the tomographic density (light blue) showing the tilted positions of Sdk1 horseshoe heads (magenta and orange) to cell membranes. (G) An isosurface of tomographic density (green) showing the connections and organization of Sdk1 Ig1∼6 molecules between cell membranes. (H) An isosurface of tomographic density (green) showing the connections and organization of Sdk2 Ig1∼6 molecules between cell membranes. (I) The averaged intermembrane distances (D) and the distances between the Sdk connections (d) in the Sdk mediated adhesion interfaces. (J) A structural model of a homophilic pair of Sdk between cell membranes. (K) A model of the cell adhesion interface mediated by Sdk molecules. (Scale bars: 25 nm.)

