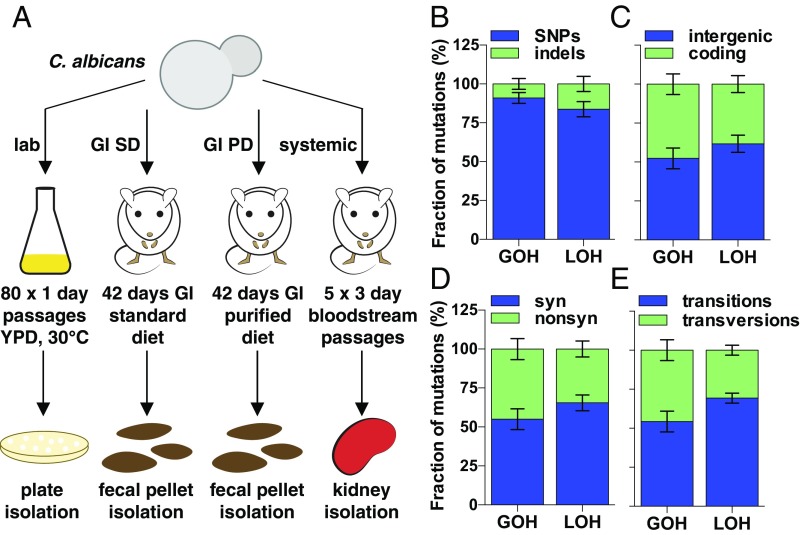
Fig. 1.
Microevolution of C. albicans genomes. (A) Schematic of in vitro and in vivo microevolution experiments. (B) Distribution of SNPs and indels, (C) intergenic and coding mutations, (D) synonymous and nonsynonymous mutations, and (E) transitions and transversions. Data are averaged across all microevolution experiments. Note that panels indicate mutations resulting from either GOH or LOH events.

