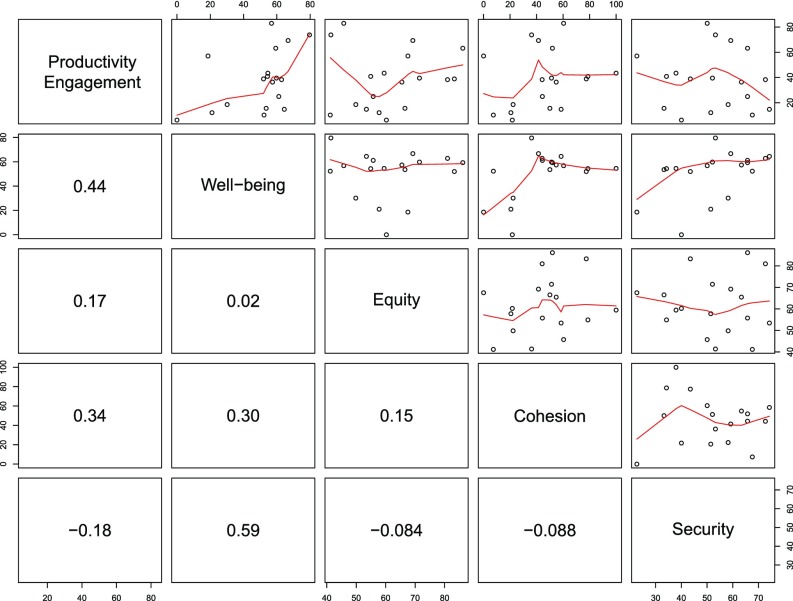
Fig. 3.
Scatterplots and correlations of domain scores in the Aging Society Index. The data plotted in the boxes showing the red lines are scatter plots of countries’ respective domain scores. The numbers shown in the boxes are the Spearman correlation coefficients. The red line represents locally weighted scatterplot smoothing. The first column contains the rs of productivity with the four domains (r = 0.44 with well-being, r = 0.17 with equity, r = 0.34 with cohesion, and r = −0.18 with security). The first row illustrates the respective scatterplots of productivity with (i) well-being, (ii) equity, (iii) cohesion, and (iv) security. Among all the correlations, only well-being and security were statistically significant (r = 0.59, P = 0.011). Productivity and well-being were borderline significant (r = 0.44, P = 0.067).

