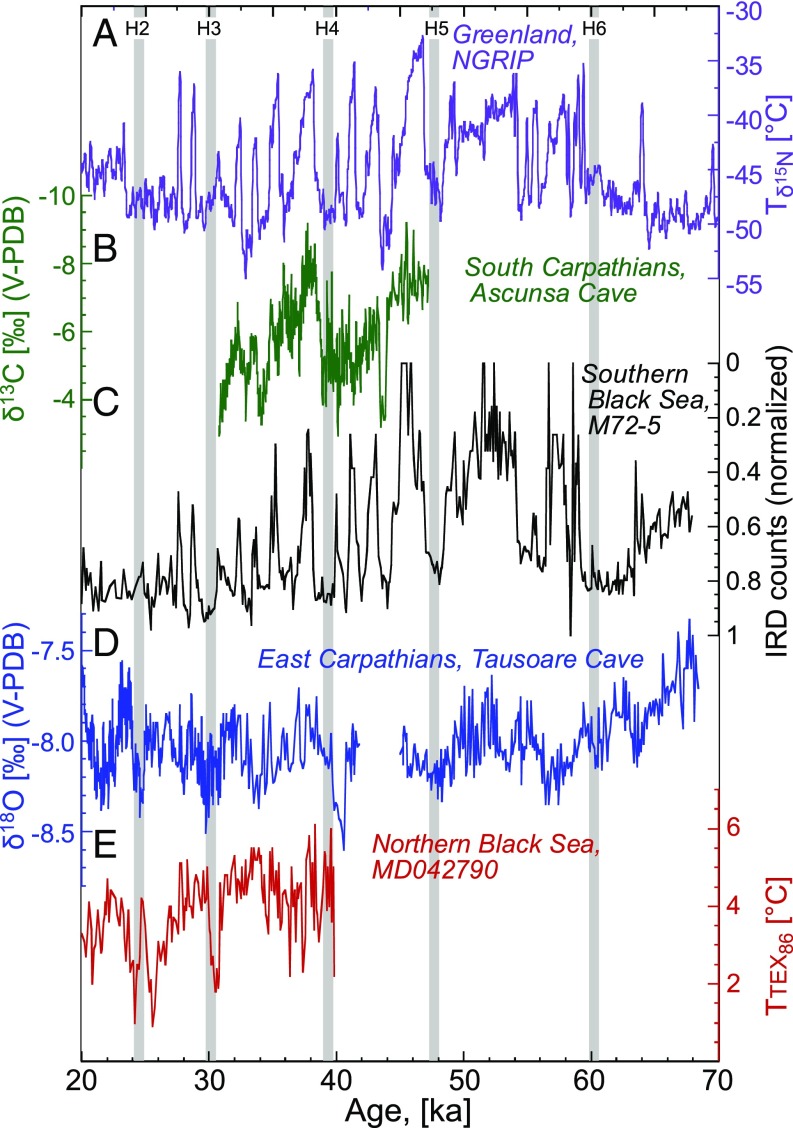
Fig. 1.
(A) Greenland: North Greenland Ice Core Project (NGRIP) temperature (8). (B) South Carpathians: δ13C of stalagmite POM1 from AC. (C) Southern Black Sea: coastal IRD abundance in core M72-5 (11). (D) East Carpathians: δ18O of stalagmite 1152, TC. (E) Northern Black Sea: TEX86 summer sea surface temperatures (33). The gray bars indicate Heinrich stadials. A map with locations of records is available in SI Appendix, Fig. S1.

