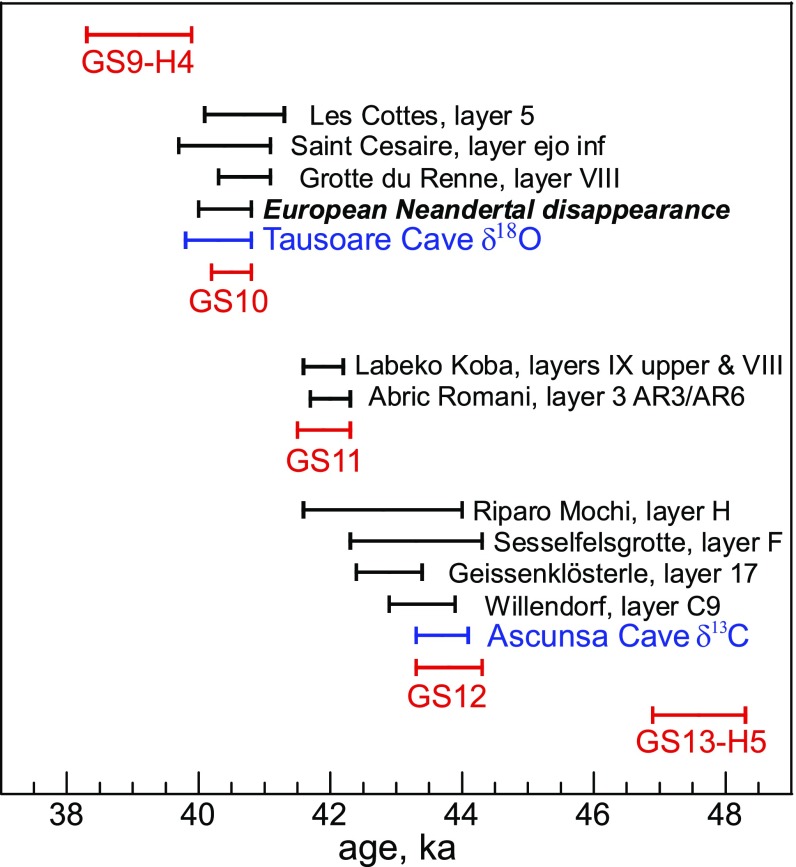
Fig. 3.
The temporal pattern of Greenland stadials (red), prominent events in the Central European speleothem record (blue), and culturally (near-)sterile layers in archeologic records of Western and Central Europe (black). For stadials and speleothems, the bar shows the duration. For archeologic layers, the bar shows the 68% age interval (ka, cal BP) defined by the youngest date of the preceding layer and the oldest date of the succeeding layer. For details on archeologic radiocarbon chronologies, see SI Appendix, Table S2. A map with the locations of records is available in SI Appendix, Fig. S1.

