Fig. 3.
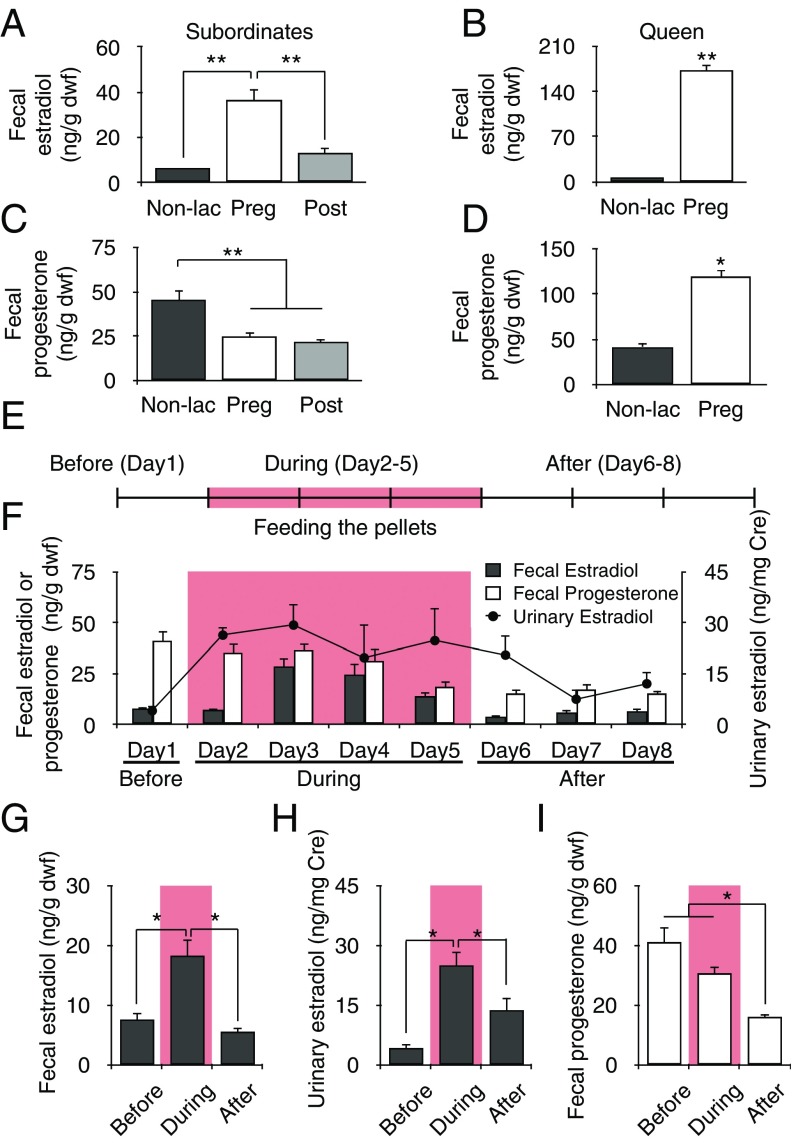
Subordinates can change their estradiol concentrations by oral ingestion. Fecal estradiol concentrations in subordinates (A) and the queen (B) during different reproductive periods. (A) Subordinates (n = 15) showed an increase in estradiol concentrations during the gestation period (white) compared with that in the nonlactation (black) and postpartum period (gray). (B) Estradiol concentration in the queen increased more during the gestation period (white, n = 3) than in the nonlactation period (black, n = 3). Fecal progesterone concentrations in subordinates (C) and the queen (D) during different reproductive periods. In subordinates (n = 15), fecal progesterone concentrations decreased during the gestation period (white) and postpartum period (gray) compared with that in the nonlactation period (black). (D) Progesterone concentration in the queen increased more during the gestation period (white, n = 3) than in the nonlactation period (black, n = 3). (E) Schematic diagram of the feeding of food pellets and sampling schedule. We sampled feces and urine from each subordinate for 8 d and fed the pellets containing estradiol and progesterone for 4 d (pink, from day 2 to day 5). (F) Fluctuations in fecal estradiol (black bar) and progesterone (white bar) and urinary estradiol (black circle) concentrations in subordinates; abbreviations follow the schematic diagram in E. Day 1, before (fecal estradiol, urinary estradiol: n = 5, 5); day 2, during (n = 5, 4); day 3, during (n = 5, 4); day 4, during (n = 5, 4); day 5, during (n = 5, 3); day 6, after (n = 5, 4); day 7, after (n = 5, 3); and day 8, after (n = 5, 4). (G) Fecal estradiol increased during feeding with pellets (n = 5, days 2–5) compared with before (n = 5, day 1) and after (n = 5, days 6–8) the feeding. (H) Urinary estradiol increased during feeding with pellets (n = 5) compared with that before (n = 5) and after (n = 5) feeding with pellets. (I) Fecal progesterone decreased after feeding with pellets (n = 5) compared with before (n = 5) and during (n = 5) feeding. *P < 0.05, **P < 0.01. Fecal estradiol concentrations [nanograms per gram of dry weight of feces (dwf)] or urinary estradiol concentrations [nanograms per milligram of creatinine (Cre)] are represented as mean ± SEM.

