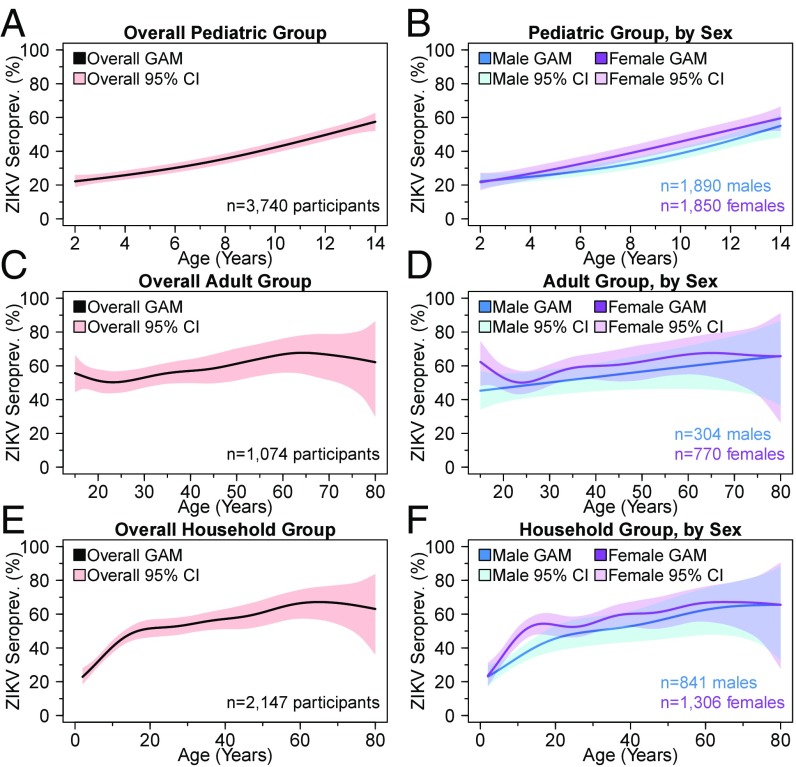
Fig. 2.
Overall and sex-specific ZIKV seroprevalence trend lines by age. ZIKV seroprevalence was graphed based on GAM trend curves, with 95% confidence bands estimated from cluster bootstrapping 10,000 at the household level for the pediatric (A and B), adult (C and D), and household (E and F) groups. Overall (pink) as well as sex-specific (blue and purple) trend lines are presented.

