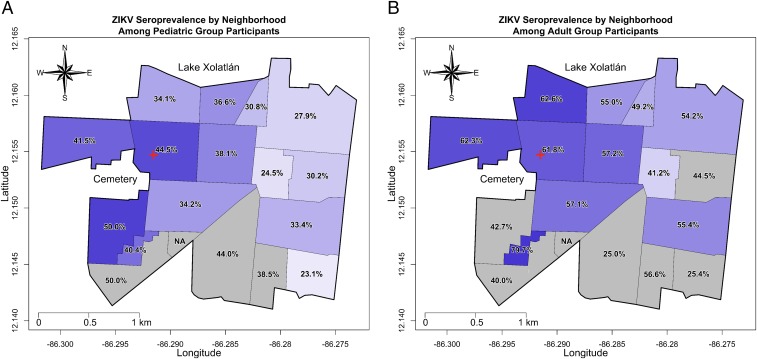
Fig. 4.
Map of neighborhood-specific ZIKV seroprevalence estimates for the pediatric and adult groups. The ZIKV seroprevalence estimates for each neighborhood were mapped for the pediatric group (A) and the adult group (B). The shade of each neighborhood corresponds to its ZIKV seroprevalence (darker shading corresponding to higher seroprevalence). Neighborhoods shaded in gray represent those in which the point estimate may be statistically inconsistent as a result of a low sample size. The red cross signifies the location of the HCSFV.

