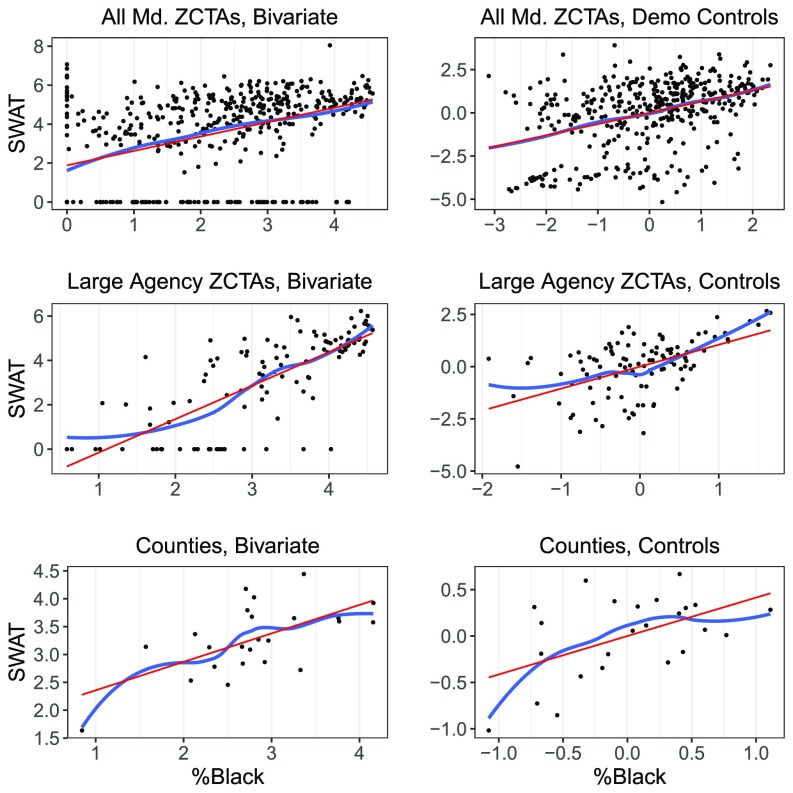
Fig. 1.
SWAT deployments are more frequent in areas with high concentrations of African Americans. (Top row) Maryland ZCTAs. (Middle row) ZCTAs from three large Maryland agencies. (Bottom row) Maryland counties. Left column shows bivariate relationships. Right column controls for social indicators in corresponding geographic unit. Locally weighted and linear regression fits are shown. Variables are plotted on log scales.

