Fig. 4.
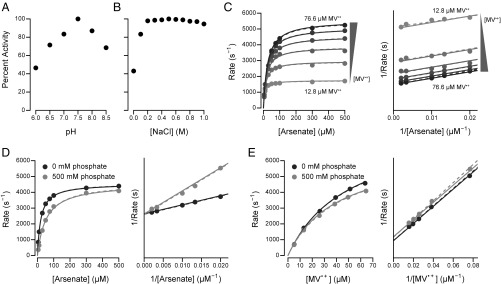
Kinetic characterization of Arr. Enzyme rates are shown as molecules of arsenate reduced per second per molecule of protein. Dashed lines illustrate a kinetic model fit for each curve individually. Solid lines illustrate a single kinetic model fit to all datasets together. For clarity, double-reciprocal plots omit the y-axis tick marks and begin at 0 s−1. For C–E, the assays were performed at pH 7.5 and 300 mM NaCl. (A) Relative activity of Arr as a function of pH. (B) Relative activity of Arr as a function of NaCl concentration. (C) Enzyme rates as a function of arsenate and MV•+ concentration. Parallel lines on the double-reciprocal plot (Right) indicate ping-pong kinetics. (D) Enzyme rates as a function of arsenate and phosphate concentration. The MV•+ concentration was 51.1 μM. Intersecting lines at the y axis on the double-reciprocal plot (Right) indicate competitive inhibition. (E) Enzyme rates as a function of MV•+ and phosphate concentration. The arsenate concentration was 250 μM. Parallel lines on the double-reciprocal plot (Right) indicate uncompetitive inhibition.

