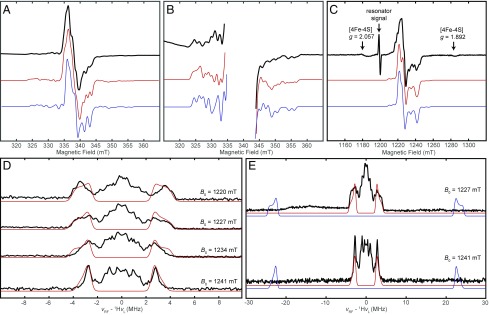
Fig. 5.
EPR characterization of the Mo(V) species generated in Arr. Samples contained 50 µM protein, 50 mM Hepes buffer (pH 7.5), 10 mM sodium dithionite, 1 µM methyl viologen, and 10 mM sodium arsenate. Simulation parameters are indicated in Table 2. (A) X-band CW EPR spectrum of Arr acquired at 120 K (black trace) with a simulation of the arsenite-bound Mo(V) species (red trace) compared with a simulation of a putative Mo(V)–OH species (blue trace) with the same simulation parameters except that the coupling to 75As has been replaced with a hyperfine coupling to 1H of A = [44, 49, 45] MHz. Acquisition parameters: microwave frequency, 9.390 GHz; microwave power, 1 mW; modulation amplitude, 0.4 mT. (B) Enlarged view of same X-band CW EPR spectrum (black trace) in A and simulations of the arsenite-bound Mo(V) species (red trace) and putative Mo(V)–OH species (blue trace) showing the low-intensity features from the hyperfine interaction with 95/97Mo. (C) Pseudomodulated Q-band ESE–EPR spectrum of Arr acquired at 12 K (black trace) with a simulation of the arsenite-bound Mo(V) species (red trace) compared with a simulation of a putative Mo(V)–OH species (blue trace) with the same simulation parameters except that the coupling to 75As has been replaced with a hyperfine coupling to 1H of A = [44, 49, 45] MHz. (D) Field-dependent Q-band 1H Davies ENDOR of the Mo(V) species in Arr (black trace) with a simulation of the largest observed 1H hyperfine coupling (red trace). (E) Wide Q-band 1H Davies ENDOR of the Mo(V) species in Arr (black trace) with a simulation of the largest observed 1H hyperfine coupling (red trace) compared with a simulation of the expected 1H ENDOR signals for the putative Mo(V)–OH species with 1H A = [44, 49, 45] MHz, which do not appear in the experimental spectrum to any significant degree.

