Fig. 2.
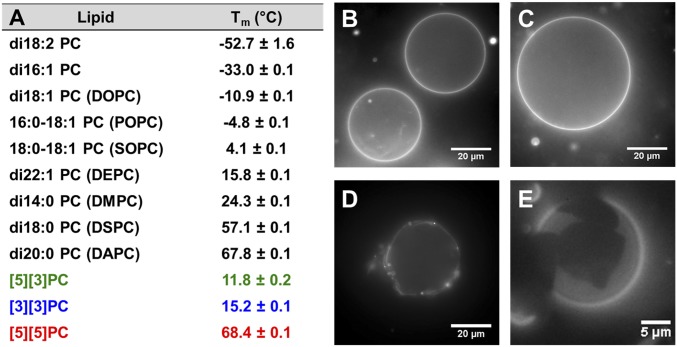
Transition temperatures and formation of GUVs. (A) Tms of aqueous lamellar dispersions of PCs in 1:1 ethylene glycol/NaH2PO4 buffer measured by DSC. (B–E) Fluorescence microscope images of GUVs (TR-DHPE or DiI, 0.1 mol %) in 500 mM sucrose. For additional images see SI Appendix, Fig. S3. (B) [3][3]PC, (C) [5][3]PC, (D) [5][5]PC, (E) 1:1 [3][3]PC:[5][5]PC.

