
Figure 3.
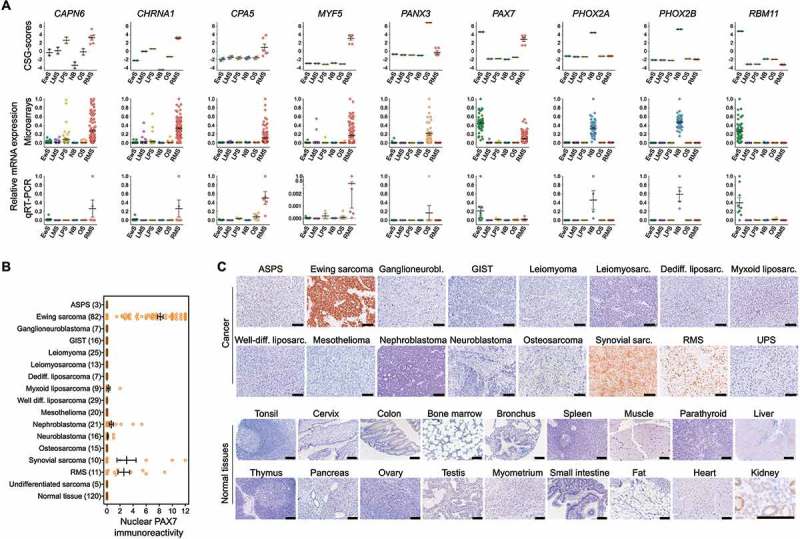
Validation of the expression pattern of selected CSGs by qRT-PCR and IHC. A) Upper and middle panel: CSG-scores and corresponding expression intensities (natural scale) of selected genes in primary Ewing sarcoma (EwS, n = 50), neuroblastoma (NB; n = 49), rhabdomyosarcoma (RMS; n = 101), liposarcoma (LPS; n = 50), leiomyosarcoma (LMS, n = 50) and osteosarcoma tumors (OS, n = 40). Lower panel: Relative expression levels of the same genes as determined by qRT-PCR in EwS (n = 9), NB (n = 4), RMS (n = 5) and LPS (n = 3), LMS (n = 3) and OS (n = 6) cell lines. B) Analysis of nuclear PAX7 immunoreactivity by IHC in indicated primary tumors and normal tissues. ASPS, alveolar soft part sarcoma; GIST, gastrointestinal stromal tumor. Numbers of analyzed samples are given in parentheses. C) Representative images of nuclear PAX7 IHC staining in cancer and selected normal tissues. Scale bar = 300 µm. UPS, undifferentiated pleomorphic sarcoma. Note: In renal proximal tubules non-specific cytoplasmic staining for PAX7 was observed, while all nuclei showed no PAX7 immunoreactivity. This non-specific cytoplasmic stain has been previously described for the employed anti-PAX7-antibody.56