Figure 4.

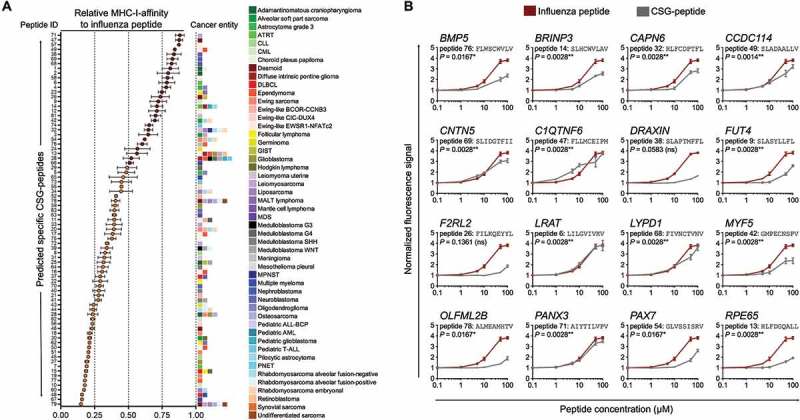
Validation of MHC-affinity of CSG-encoded peptides in a T2-binding assay. A) Relative MHC-I-affinity of 79 selected peptides at 100 µM in T2-binding assays as compared to a highly affine influenza peptide (peptide sequences are given in Supplementary Table 6). The colored boxes at the right side of the graph represent the number and type of cancer entities in which the corresponding CSG encoding the indicated peptide is overexpressed. Peptides with an MHC-affinity of ≥ 50% of the influenza peptide are highlighted in red color. Data are presented as mean and SEM of n ≥ 3 experiments. ALL, acute lymphoblastic leukemia; AML, acute myeloid leukemia; ATRT, atypical teratoid/rhabdoid tumor; CLL, chronic lymphatic leukemia; CML, chronic myeloid leukemia; DLBCL, diffuse large B cell lymphoma; GIST, gastrointestinal stromal tumor; MALT, mucosa associated lymphatic tissue; MPNST, malignant peripheral nerve sheath tumor; PNET, primitive neuroectodermal tumor. B) Normalized fluorescence signals of 16 selected peptides with high MHC-affinity as compared to that of a highly affine influenza peptide in T2-binding assays. Data are presented as mean and SEM of n ≥ 3 experiments. P values of a Spearman’s rank-order correlation are reported.
