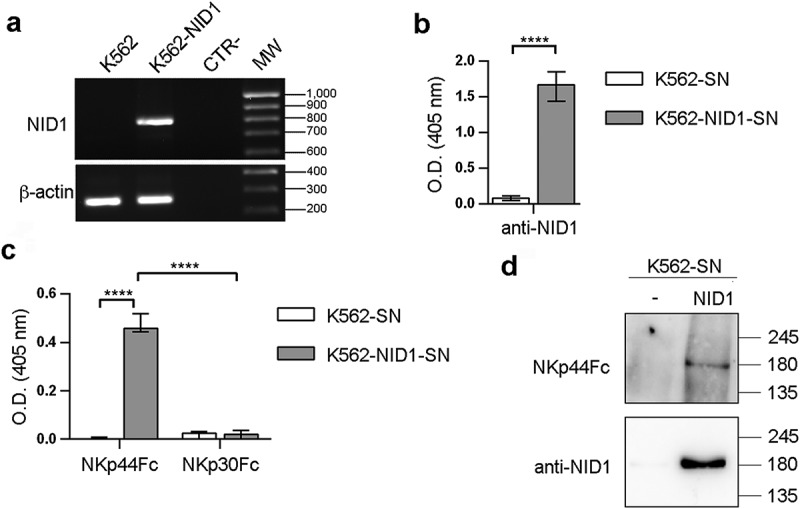
Figure 4.

NKp44Fc recognizes NID1 released by NID1-transfected K562 cells. (A) NID1 mRNA expression was assessed by RT-PCR in wild type or NID1-transfected K562 cells. Primers specific for β-actin were utilized as positive control. PCR products were run on 1.5% agarose gel and visualized by ethidium bromide staining. One representative experiment of three is shown. (B, C) ELISA plates were coated with mouse anti-NID1 mAb (B) or with the indicated Fc molecules (C), followed by incubation with concentrated SN obtained from untransfected or NID1-transfected K562 cells cultured in protein-free medium. NID1 was detected using a goat anti-NID1 Ab followed by a HRP-conjugated anti-goat IgG Ab. Graphs represent absorbance at 405 nm after normalization to background (nonspecific binding of goat anti-NID1 + secondary reagent). Data are medians of triplicates ± interquartile range and are the pooled results of three independent experiments. ****p < 0.0001 by two-tailed Mann-Whitney test. (D) Concentrated SN (30 μl for each sample) derived from K562 cells and the corresponding NID1 transfectants cultured in protein-free medium were analyzed in SDS-PAGE on a 7.5% polyacrylamide gel; membrane was probed with NKp44Fc molecule or with mouse anti-NID1 mAb followed by the appropriate HRP-conjugated secondary mAb. MW markers (kDa) are indicated on the right. One representative experiment of two is shown.
